Catégories
Geographic markets

Top 20 tourist destinations and source markets

According to World Tourism Organization (WTO) estimates, the number of international tourist arrivals reached 1.2 billion in 2015, an increase of 25% over 2010.* Seen over the longer term, growth has been exponential.

Since the WTO compiles national statistics, methodologies may vary. For this reason, results must be interpreted with caution. In addition, results for the year 2015 were estimated based on partial data for some destinations. This article is an update of the 2011 analysis Global ranking of destinations and source markets.

Constantly shifting rankings

Not only has the ranking of destinations changed dramatically over the years, the sheer number of countries visited by tourists has increased tremendously. Here are some interesting observations about the number of international arrivals at the most popular destinations (Table 1):

  • The top 5 countries in the ranking accounted for 43% of all arrivals in 1970, and only 28% in 2015. Countries not included in the list of 15 top-ranked destinations for international tourist arrivals accounted for 3% of such arrivals in 1950, 34% in 1990 and 46% in 2015.
  • Canada’s ranking dropped from 2nd in 1970 to 14th in 2010 and to 18th in 2015.
  • China has become an extremely popular destination.
  • Malaysia, Turkey and Hong Kong have also made major inroads into the tourism market.
  • The top 5 destinations have remained more or less the same since the year 2000. France attracted more visitors than last year, but its rate of growth is slowing. China closely followed Spain in 2015, and both were right behind the United States.
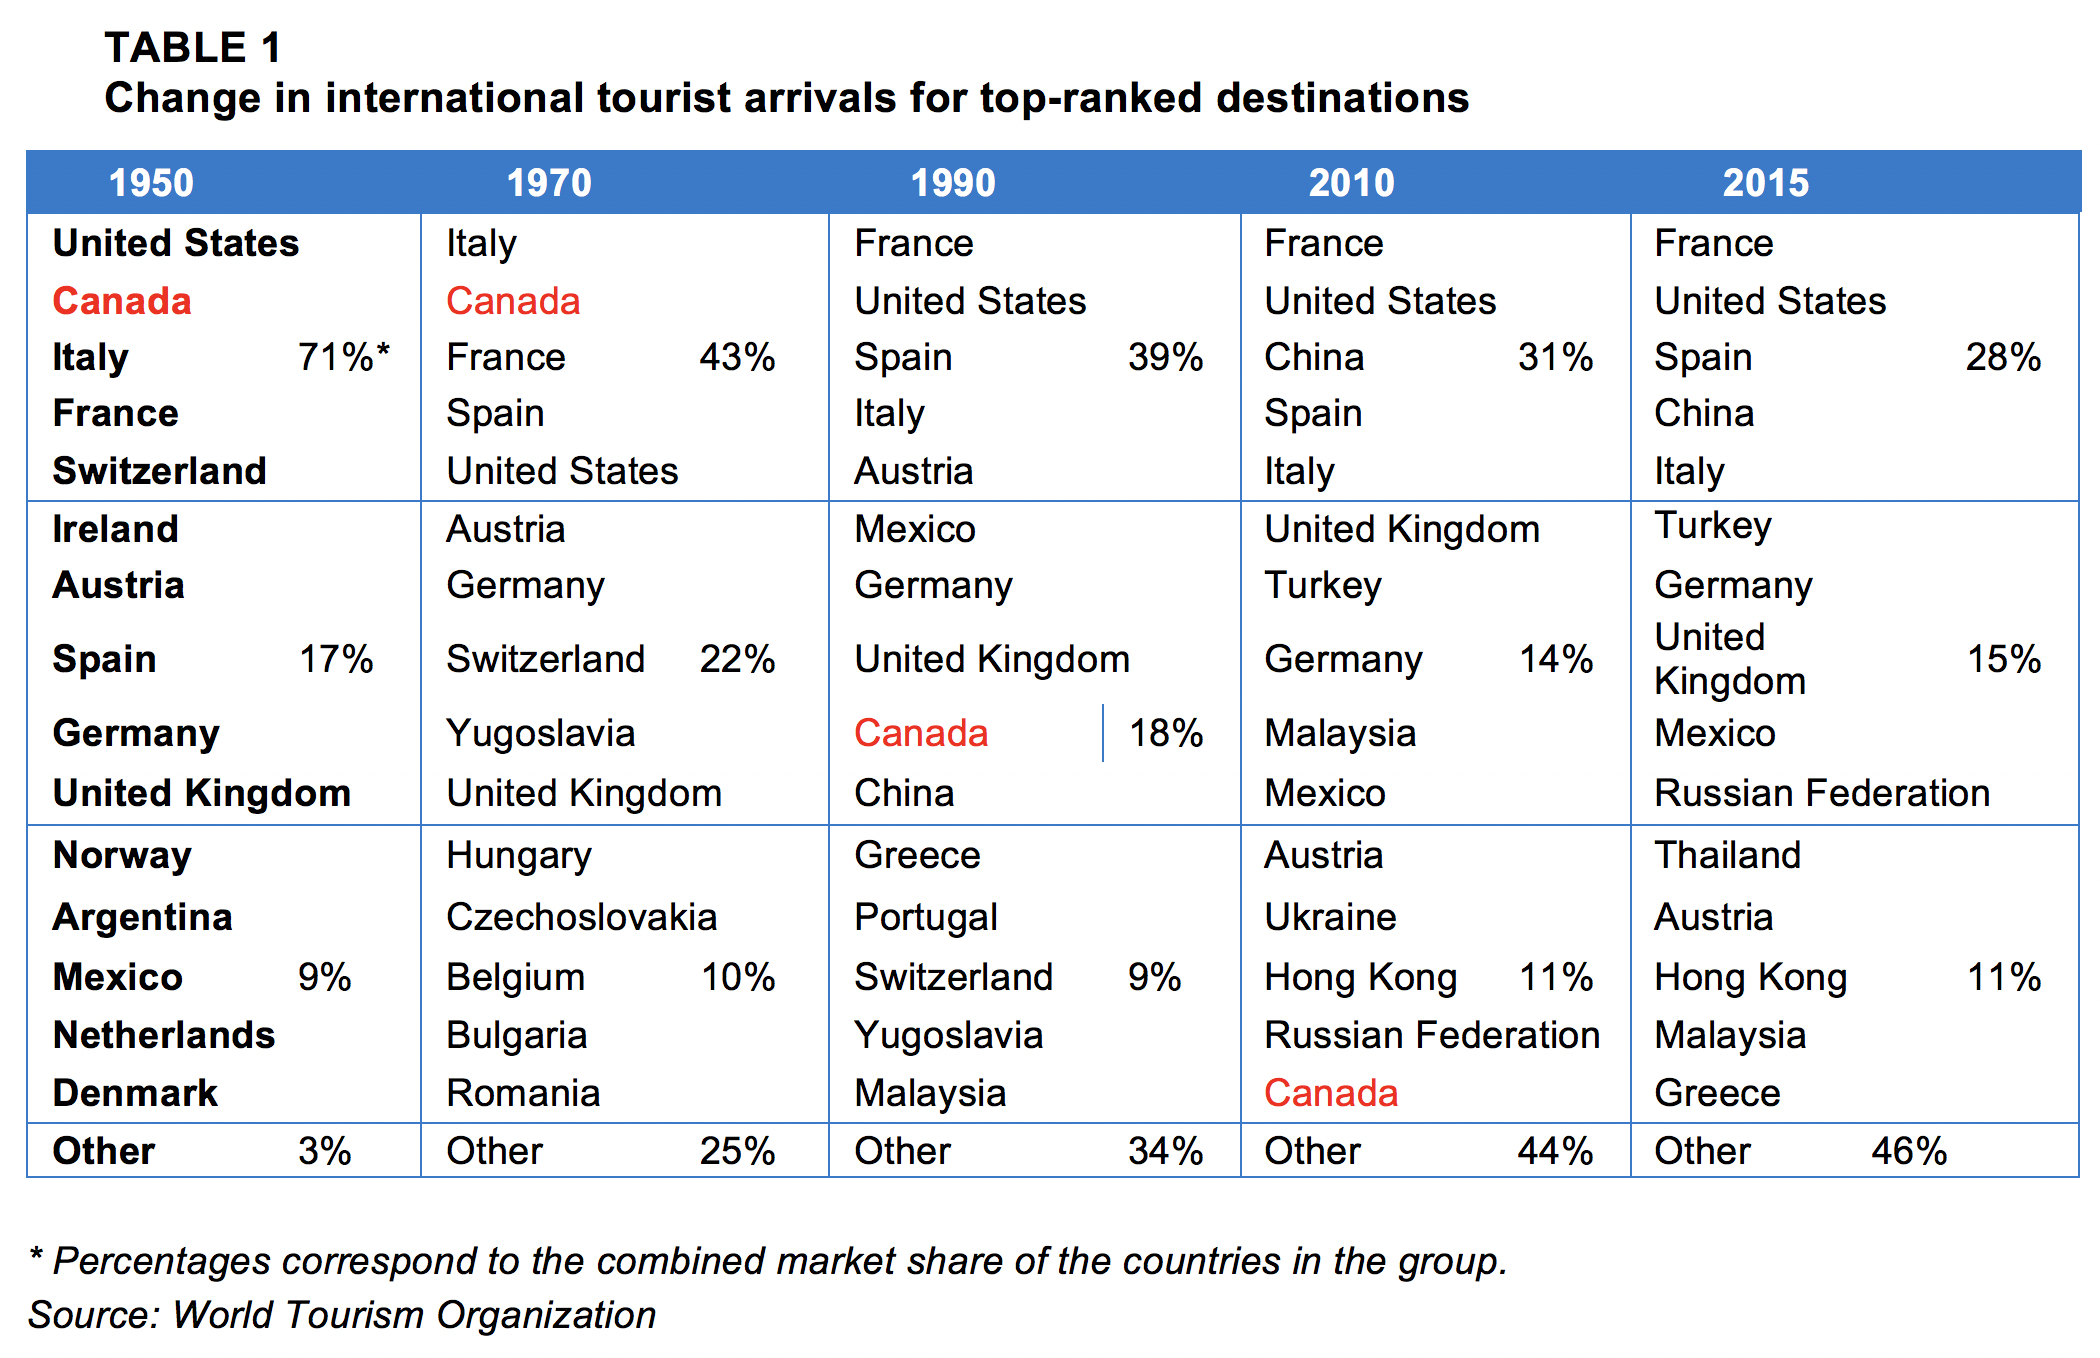
Tab 1_top_15_tourist_destinations

Copie de WORLD NEWS

Tourism arrivals and tourism receipts: Two realities

Graphs 1 and 2 illustrate the top 20 destinations by international tourist arrivals and by international tourism receipts, respectively. The two rankings differ somewhat. Although France is the number 1 destination in terms of international tourist arrivals, it was ranked 4th in terms of tourism receipts. The United States holds the top position on the latter ranking, well ahead of Spain and China, the next two on the list. While several countries occupy similar rankings in both graphs, others appear in one and are completely absent from the other. Some countries have relatively high tourism receipts for the number of visitors: Australia (42nd in terms of international tourist arrivals), India (40th), Switzerland (36th) and Singapore (26th).


Graph1_top_20_Tourist_arrivals

Graph2_top_20_international_receipts

Although the overall increase in international tourist arrivals benefited all the countries in the top 20, Graph 3 illustrates significant differences among the various countries. Canada recorded growth of 13%, one of the lowest rates among all the destinations, which explains its drop in the rankings. Japan staged a comeback, increasing the number of international tourist arrivals from 8.6 to 29.5 million in 5 years. This increase is due to some external factors (depreciation of the yen and economic growth in China) as well as Japan’s decision to deregulate its aviation industry and facilitate visas for travellers from China, Malaysia and Thailand, making the country more accessible. Thailand, Saudi Arabia and Greece also saw significant increases in the number of tourists.

Graph.3_top_2_tourist_arrivals_change

Where do most travellers come from?

The data in Table 2 about tourist-generating countries is expressed in terms of international tourism expenditures as published by the WTO, not in terms of the number of trips. Total spending grew from US$495 billion in 2000 to US$986 billion in 2010, and then to US$1.26 trillion in 2015, for an overall increase of 154%. In 2015, 28 countries recorded international tourism expenditures of at least US$10 billion, while only 10 countries did so in 2000.

China has experienced explosive growth in international tourism expenditures, increasing 1240% in the past 10 years. Although a large part of this growth can be attributed to intraregional travel, China is still a huge outbound market. Chinese travellers spent an estimated US$292 billion outside the country in 2015. In comparison, travellers from the United States (the number two source market) spent US$113 billion and Canadians only US$29 billion. In Canada, the number of travellers from China in 2016 surpassed those from France, which was ranked 2nd. Other countries in the Asia and Pacific region also significantly increased their international tourism expenditures (Republic of Korea, Hong Kong and Singapore). It is crucial to continue efforts to develop direct flights with this region.

Germany, the United Kingdom and France occupy the next positions in the ranking. Japan moved from 5th in 2005 to 19th in 2015. Although several countries have seen a drop in their international tourism expenditures, the case of Japan is the most dramatic. Canadians spend a lot on international travel, ranking 7th.

Tab2_tourist_generating_expenditures

Focus on attractiveness and accessibility

International tourism continues its fantastic growth, attracting more and more travellers. Remaining competitive is a challenge for everyone. Although distances are less daunting than before, Quebec does not enjoy close proximity with major outbound Asian markets, nor does it benefit from the presence of low-cost flights linking it to a number of neighbouring countries as is the case in Europe, in particular. Efforts to increase destination attractiveness and accessibility are thus doubly important.

Source of image on page one: Pexels

Catégories
Geographic markets

Overview of Canadian Outbound Travel

Frequent travellers, Canadians spend a lot when they travel and are open to emerging destinations. However, they also enjoy long-standing favourites, with the United States accounting for nearly three-quarters of their international trips. At the same time, they are strongly attracted to the sun and beach. The Caribbean, notably Cuba and the Dominican Republic, and Mexico have been welcoming growing numbers of Canadians for the past several years. European countries, predominantly France and the United Kingdom, remain favourite destinations. The image below illustrates some key figures.

canadian_outbound_travel_overview

Significant spending

According to a study published by the European Travel Commission, Canadian outbound travel grew by nearly 6% annually between 2004 and 2013. The World Tourism Organization ranks Canadian travellers 7th, in terms of international tourism expenditure: they spent CN$37 billion in 2013 (excluding the cost of international travel), or more than double what they spent 10 years ago.

In 2015, travellers from Ontario recorded the greatest number of trips abroad by far, accounting for 15 million, followed by those from British Columbia and Quebec. Compared to 2014, the number of trips to countries other than the United States increased by over 10% in each of these three markets.

number_of_canadian_trips_abroads_in_2015_figure_1

Favourite destination: the United States

Canadian travel to the United States grew by an average 7% annually for at least a decade, up until 2013. Since then, the number of trips to the United States has dropped, in part because of the changing exchange rate.

As the following figure illustrates, travel to other destinations has grown almost every year. In the last 15 years, the number of leisure trips taken by Canadians outside the country has jumped 92%.

number_of_canadian_trips_abroads_200_2015_figure_2

Sun destinations and Asia on the rise

The Caribbean and Mexico are very appealing to Canadians, attracting nearly 5 million Canadian visitors in 2015. The 4.7% increase in travel from 2014 to 2015 is almost entirely due to the growth of arrivals to Cuba, Mexico and the Dominican Republic. Together, these three destinations account for over three-quarters of the Canadian trips to this region. Figure 3 illustrates this growth since 2012.

number_of_canadian_trips_in-mexico_cuba_republic_dominica_figure_3

Countries in the Asia/Pacific region have also seen an appreciable increase in the number of Canadian visitors, welcoming 2.4 million in 2015. As Figure 4 shows, China, Hong Kong, Japan and Thailand are the most popular destinations.

More European destinations

According to the Conference Board of Canada (based on estimates from 24 countries), Europe received more than 4.7 million Canadian arrivals in 2015. For many years, France, the United Kingdom, Italy, Germany and Spain have accounted for two-thirds of Canadien trips to Europe. However, less traditional European destinations like Greece, Finland and Croatia have been making significant inroads into the Canadian market. Primarily chosen as a summer vacation destination, Europe welcomed 6.2% more Canadian visitors in the winter of 2015-2016, compared to the previous winter.

canadian_arrivals_destinations_2014_2015_figure_4

Independent travellers

Canadians are primarily independent travellers (FIT), opting for personalized itineraries rather than organized programs. For Canadian travellers, the purpose of stay in Europe is not the same as that for other destinations. While 14% of trips to the United States are taken to visit friends and relatives, this proportion rises to 38% in the case of travel to Europe. In addition, the percentage of Canadians travelling for business is higher in Europe than elsewhere.

canadian_travel_purpose_stay_figure_5

Drivers of growth

Several elements will drive the growth of Canadian outbound travel in the coming years:

  • Although it is modest, Canada is in a period of economic growth.
  • Baby-boomers , which represent a significant portion of the population (29%), are gradually retiring. These individuals have a lot of discretionary income and want to travel.
  • The demand for travel to visit friends and relatives is high among Canadian residents from various ethnic communities who travel to their country of origin.
  • Canadians are familiar with digital marketing and are among the most active populations on social media. Destinations are using effective measures in the field of digital technology to increase their promotional efforts, which should stimulate Canadian outbound travel.

Image on first page: ©StockSnap

Catégories
etourism and technology Marketing @en

Show me the room!

When it comes to reserving a hotel room online, what criteria are important? According to a recent survey of US internet users, being able to see the place is key. With the increased adoption of high-speed internet, suppliers can now do a better job selling an experience, rather than just a price.

According to a recent survey of approximately 2,900 adult US internet users conducted by Harris Interactive for VFM Interactive, after considering price and location, consumers now want to see photos when they reserve a hotel room. In fact, 73% of the respondents who stay in hotels said they went online to research their accommodations. Of this number, 71% considered the written description very important while 69% said the same of the visuals.

The survey also showed that some groups of online travellers are more interested in the visual aspect than others.

This is true for the following:

  • women (36%), compared to 21% for men
  • families with children; in fact, 35% of households with children find visuals important, versus only 25% of those without children

For 28% of online travellers, visuals were rated « very important, » ahead of:

  • description of property (23%)
  • information about the destination (17%)
  • star ratings (14%)
  • customer testimonials (13%)
  • hotel brand (11%)

Internet and streaming video

Streaming video is a technology that should encourage the travel industry to take a second look at the internet. With its ability to transmit both audio and video, the internet is ideal for conveying information, and with the increased use of high-speed (broadband) connections, streaming video is now more common.

Although still photographs work well as promotional tools, streaming video is an even more effective medium. All businesses using the internet to sell or promote products should consider the use of this technology:

  • a night in a hotel (the Ice Hotel, for example)
  • a day at a spa (the Scandinavian Spa in Tremblant, for example)
  • a show (in Las Vegas, for example)
  • an entire region (BonjourQuebec.com, for example)
  • a gourmet meal in a top-rated inn
  • a tour of the Père-Lachais cemetery in Paris
  • or any other product or service
  • and don’t forget 360-degree virtual tours.

Streaming video can present a highly realistic portrait of your business: a virtual tour, an overview of the site, a demonstration of a product or service, a commercial, filmed testimonials from satisfied customers, etc.

Video can capture dreams, desires and longings. It is therefore an ideal communication tool well-adapted to the tourism and recreation sector. Video can inform and reassure consumers; it inspires trust and can help break down the final barriers to the act of purchasing.

It is not complicated to add streaming video to a website (webcasting). However, for visitors to be able to view it, they must have an appropriate multimedia application (that can be downloaded for free). Although Media Player is the most common program for Windows users, it is always a good idea to offer videos in several different versions so they can be read by other applications like Real Player and QuickTime, for example.

Although the quality of the video depends on the user’s connection speed, the technology is very promising because it can make information available in real time, just like television. And with more and more homes now enjoying the same type of high-speed connections found in workplaces, the market should really explode in the coming years.

When speed is an advantage

According to a recent survey of 3,000 Canadians conducted in May and June of 2004 by the Canadian Internet Project (CIP), 72% of the Canadian population uses the internet, either from public or private sites. Some of the survey’s other findings:

  • a majority of Canadians use the internet a lot: 56% say they spend at least seven hours per week online
  • most of the time, they use the internet at home or at work, rather than in public places
  • internet users spend less time than non-users on traditional media like television or newspapers and magazines

In Canada, broadband internet services have made major inroads in a short time. In 2003, 66% of businesses had high-speed access (compared to only 48% in 2001). Overall, in both homes and workplaces, Canada is a world-wide leader in broadband penetration. In fact, in 2005, 67% of Canadian households enjoyed broadband access and some experts believe that this number will rise to 81% by the year 2007.

In the United States, according to the latest estimates of the Pew Internet & American Life Project, broadband adoption at home has also grown in recent years. In May 2005, 53% of the internet users surveyed had a high-speed connection at home (compared to 50% in December 2004).

In conclusion, high-speed internet and related technologies like streaming video are proving to be fundamental tools for businesses of all sizes. For users, the technology has many advantages, and with the growing popularity of media for private viewing (like podcasts), videos can be downloaded and viewed on cell phones and iPods, or saved and forwarded to friends. The possibilities are endless!

Sources:
– eMarketer. « Travel Shoppers Say: ‘Show Me a Picture’, » November 16, 2005.
– PRNewswire. « The Majority of Online Travelers Rate Hotel Visuals Among Top Influencing Factors in Selecting a Hotel Online, » November 14, 2005.
– Horrigan, John. « Broadband Adoption at Home in the United States: Growing but Slowing, » Pew Internet & American Life Project, September 21, 2005.
– Uhrbach, Mark and van Tol, Bryan. « Broadband Internet: Removing the Speed Limit for Canadian Firms, » Statistics Canada, Science, Innovation and Electronic Information Division, September 2004.

Catégories
Facts and figures Management

Travel intentions vs. actual travel

The increased number of polls used to determine travel intentions has contributed to the tools used by industry decision-makers. Unfortunately, the existence of more surveys has not necessarily translated into a more accurate portrait of the future. In fact, a look back uncovers major discrepancies between Canadian travel intentions and actual travel.

It is common practice for tourism stakeholders to consult tourism forecasts when developing business strategies. People are periodically surveyed on their travel intentions so pollsters can anticipate the short-term tourism demand. We are accustomed to looking forward, but what about taking a look back? The industry has rarely taken the opportunity to compare stated travel intentions with the actual number of trips taken.

To conduct this study, we reviewed Canadian travel intentions over the past five years. To ensure reliable, homogeneous results, we looked at the findings of a poll published twice a year by the Conference Board of Canada; conducted at the same time each year, these surveys follow the same methodology and may be readily compared.

For the purpose of our analysis, we thought it best to compare the growth rate of planned vacations with the growth rate of reported trips (that is, actual trips taken). Absolute numbers are difficult to reconcile because, while vacations usually refer to stays of three days or more, Statistics Canada survey data on declared travel includes any overnight leisure trip.

Survey reliability: myth or reality?

Should the reliability of forecasts be called into question? An analysis shows that projections have proven to be very different from actual outcomes when it comes to the number of trips taken by Canadians. During the five years studied, the annual growth rates of planned trips and actual trips diverged by 17% on average, a significant gap. Furthermore, the difference between forecast and reality was never less than 10%. Obviously, many factors, including unforeseeable events, have a strong influence on the performance of a given tourism season. For example, the SARS crisis dealt a severe blow to Canadian tourism in 2003. A closer look at each year helps elucidate the reasons behind the discrepancies:

  • In 1999, the economy was in full swing and the stock market was reaching new highs. Actual travel surpassed expectations by 10%.
  • In 2000, the high-tech stock market bubble burst and the economy began to show signs of flagging. Actual travel was 14% lower than planned travel, indicating more Canadians decided to stay home that year.
    In 2001, the travel industry was rocked by the catastrophic events of September 11. However, since most vacations had already been taken before the day of the attacks, actual travel was nonetheless 14% higher than expected. Forecasts had underestimated the strong economic showing of the first three quarters of 2001.
  • In 2002, the «post-September 11» effect had a major impact on travel intentions, which dipped to an unprecedented low. In actual fact, however, Canadians resumed travelling faster than anticipated and actual travel surpassed forecasts by 15%.
  • In 2003, against the backdrop of the war in Iraq, the SARS crisis was a decisive factor in the travel decisions of many Canadians. Surveys were unable to foresee the extent of the crisis and, as a result, actual travel trailed planned travel by 21%.
  • The forecasts for 2004 once again indicate negative growth and the industry remains concerned about year-end results.

Intent is not action

Unforeseeable factors aside, there is a significant difference between the absolute number of trips taken and the number of trips planned. Generally speaking, approximately 60% of Canadians actually follow through on vacation plans made six months earlier.

According to the Conference Board, some 20 million Canadians expressed interest in travelling during 2004. This represented an 8% drop compared to 2003 travel intentions. Although one can predict the direction of the economy with some success, other factors like weather conditions, exchange rates and disruptive events are difficult to anticipate and have a major impact on consumer travel decisions.

For decision-makers, tourism forecasts make up just one variable in a complex equation involving completely unpredictable elements. Travel intention surveys may herald an annual trend, but they are no substitute for managerial instincts and should not form the basis of the decision-making process.