Catégories
Geographic markets

Top 20 tourist destinations and source markets

According to World Tourism Organization (WTO) estimates, the number of international tourist arrivals reached 1.2 billion in 2015, an increase of 25% over 2010.* Seen over the longer term, growth has been exponential.

Since the WTO compiles national statistics, methodologies may vary. For this reason, results must be interpreted with caution. In addition, results for the year 2015 were estimated based on partial data for some destinations. This article is an update of the 2011 analysis Global ranking of destinations and source markets.

Constantly shifting rankings

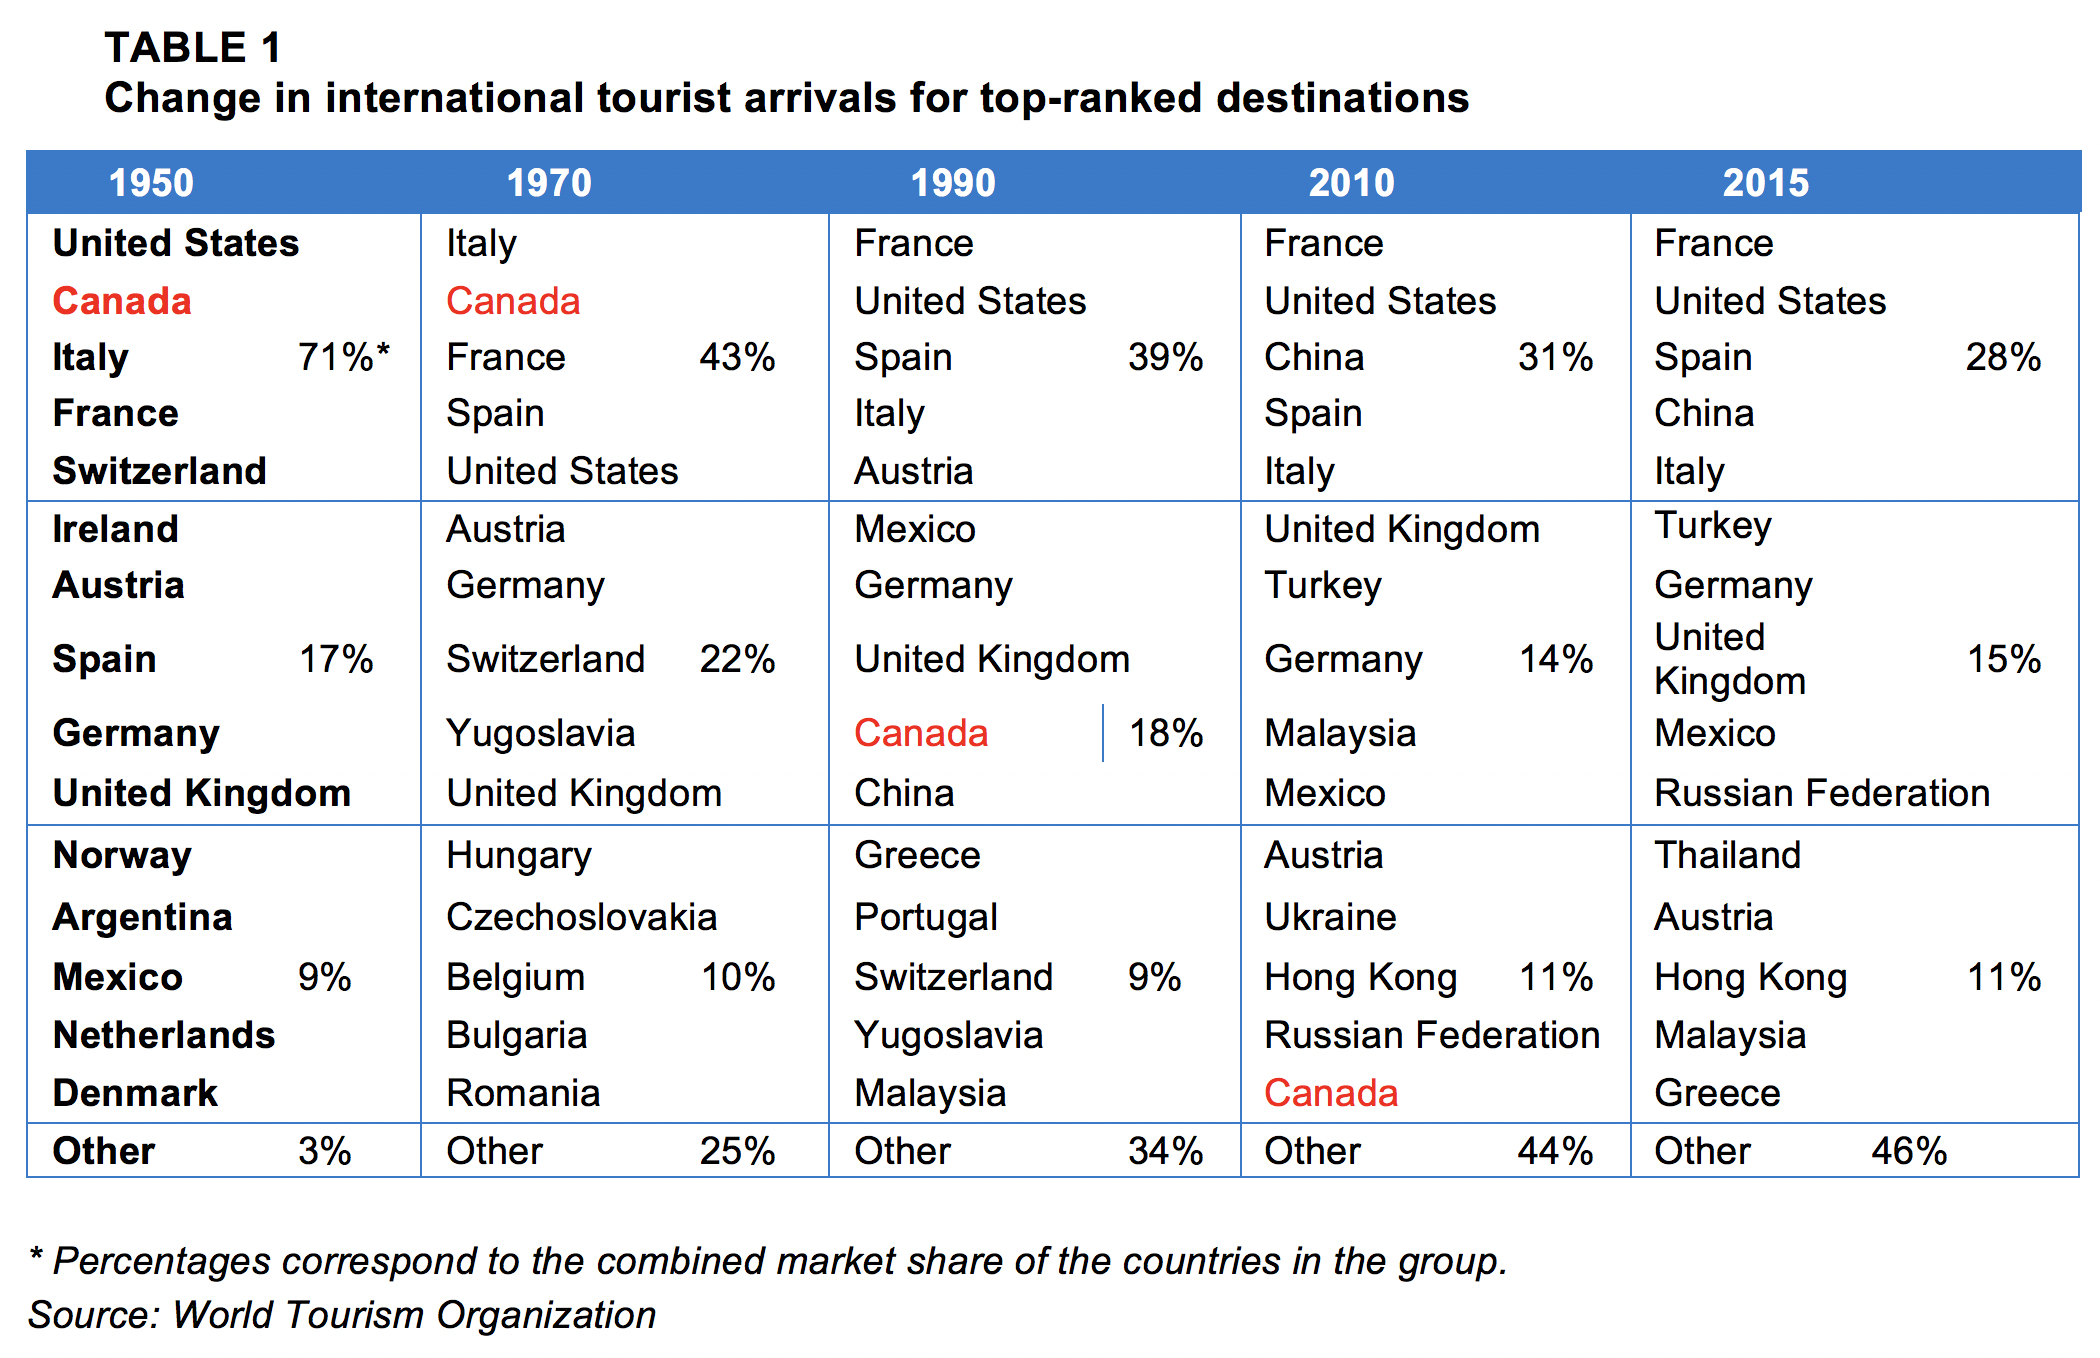
Not only has the ranking of destinations changed dramatically over the years, the sheer number of countries visited by tourists has increased tremendously. Here are some interesting observations about the number of international arrivals at the most popular destinations (Table 1):

  • The top 5 countries in the ranking accounted for 43% of all arrivals in 1970, and only 28% in 2015. Countries not included in the list of 15 top-ranked destinations for international tourist arrivals accounted for 3% of such arrivals in 1950, 34% in 1990 and 46% in 2015.
  • Canada’s ranking dropped from 2nd in 1970 to 14th in 2010 and to 18th in 2015.
  • China has become an extremely popular destination.
  • Malaysia, Turkey and Hong Kong have also made major inroads into the tourism market.
  • The top 5 destinations have remained more or less the same since the year 2000. France attracted more visitors than last year, but its rate of growth is slowing. China closely followed Spain in 2015, and both were right behind the United States.

Tab 1_top_15_tourist_destinations

Copie de WORLD NEWS

Tourism arrivals and tourism receipts: Two realities

Graphs 1 and 2 illustrate the top 20 destinations by international tourist arrivals and by international tourism receipts, respectively. The two rankings differ somewhat. Although France is the number 1 destination in terms of international tourist arrivals, it was ranked 4th in terms of tourism receipts. The United States holds the top position on the latter ranking, well ahead of Spain and China, the next two on the list. While several countries occupy similar rankings in both graphs, others appear in one and are completely absent from the other. Some countries have relatively high tourism receipts for the number of visitors: Australia (42nd in terms of international tourist arrivals), India (40th), Switzerland (36th) and Singapore (26th).


Graph1_top_20_Tourist_arrivals

Graph2_top_20_international_receipts

Although the overall increase in international tourist arrivals benefited all the countries in the top 20, Graph 3 illustrates significant differences among the various countries. Canada recorded growth of 13%, one of the lowest rates among all the destinations, which explains its drop in the rankings. Japan staged a comeback, increasing the number of international tourist arrivals from 8.6 to 29.5 million in 5 years. This increase is due to some external factors (depreciation of the yen and economic growth in China) as well as Japan’s decision to deregulate its aviation industry and facilitate visas for travellers from China, Malaysia and Thailand, making the country more accessible. Thailand, Saudi Arabia and Greece also saw significant increases in the number of tourists.

Graph.3_top_2_tourist_arrivals_change

Where do most travellers come from?

The data in Table 2 about tourist-generating countries is expressed in terms of international tourism expenditures as published by the WTO, not in terms of the number of trips. Total spending grew from US$495 billion in 2000 to US$986 billion in 2010, and then to US$1.26 trillion in 2015, for an overall increase of 154%. In 2015, 28 countries recorded international tourism expenditures of at least US$10 billion, while only 10 countries did so in 2000.

China has experienced explosive growth in international tourism expenditures, increasing 1240% in the past 10 years. Although a large part of this growth can be attributed to intraregional travel, China is still a huge outbound market. Chinese travellers spent an estimated US$292 billion outside the country in 2015. In comparison, travellers from the United States (the number two source market) spent US$113 billion and Canadians only US$29 billion. In Canada, the number of travellers from China in 2016 surpassed those from France, which was ranked 2nd. Other countries in the Asia and Pacific region also significantly increased their international tourism expenditures (Republic of Korea, Hong Kong and Singapore). It is crucial to continue efforts to develop direct flights with this region.

Germany, the United Kingdom and France occupy the next positions in the ranking. Japan moved from 5th in 2005 to 19th in 2015. Although several countries have seen a drop in their international tourism expenditures, the case of Japan is the most dramatic. Canadians spend a lot on international travel, ranking 7th.

Tab2_tourist_generating_expenditures

Focus on attractiveness and accessibility

International tourism continues its fantastic growth, attracting more and more travellers. Remaining competitive is a challenge for everyone. Although distances are less daunting than before, Quebec does not enjoy close proximity with major outbound Asian markets, nor does it benefit from the presence of low-cost flights linking it to a number of neighbouring countries as is the case in Europe, in particular. Efforts to increase destination attractiveness and accessibility are thus doubly important.

Source of image on page one: Pexels

Catégories
Geographic markets

Overview of Canadian Outbound Travel

Frequent travellers, Canadians spend a lot when they travel and are open to emerging destinations. However, they also enjoy long-standing favourites, with the United States accounting for nearly three-quarters of their international trips. At the same time, they are strongly attracted to the sun and beach. The Caribbean, notably Cuba and the Dominican Republic, and Mexico have been welcoming growing numbers of Canadians for the past several years. European countries, predominantly France and the United Kingdom, remain favourite destinations. The image below illustrates some key figures.

canadian_outbound_travel_overview

Significant spending

According to a study published by the European Travel Commission, Canadian outbound travel grew by nearly 6% annually between 2004 and 2013. The World Tourism Organization ranks Canadian travellers 7th, in terms of international tourism expenditure: they spent CN$37 billion in 2013 (excluding the cost of international travel), or more than double what they spent 10 years ago.

In 2015, travellers from Ontario recorded the greatest number of trips abroad by far, accounting for 15 million, followed by those from British Columbia and Quebec. Compared to 2014, the number of trips to countries other than the United States increased by over 10% in each of these three markets.

number_of_canadian_trips_abroads_in_2015_figure_1

Favourite destination: the United States

Canadian travel to the United States grew by an average 7% annually for at least a decade, up until 2013. Since then, the number of trips to the United States has dropped, in part because of the changing exchange rate.

As the following figure illustrates, travel to other destinations has grown almost every year. In the last 15 years, the number of leisure trips taken by Canadians outside the country has jumped 92%.

number_of_canadian_trips_abroads_200_2015_figure_2

Sun destinations and Asia on the rise

The Caribbean and Mexico are very appealing to Canadians, attracting nearly 5 million Canadian visitors in 2015. The 4.7% increase in travel from 2014 to 2015 is almost entirely due to the growth of arrivals to Cuba, Mexico and the Dominican Republic. Together, these three destinations account for over three-quarters of the Canadian trips to this region. Figure 3 illustrates this growth since 2012.

number_of_canadian_trips_in-mexico_cuba_republic_dominica_figure_3

Countries in the Asia/Pacific region have also seen an appreciable increase in the number of Canadian visitors, welcoming 2.4 million in 2015. As Figure 4 shows, China, Hong Kong, Japan and Thailand are the most popular destinations.

More European destinations

According to the Conference Board of Canada (based on estimates from 24 countries), Europe received more than 4.7 million Canadian arrivals in 2015. For many years, France, the United Kingdom, Italy, Germany and Spain have accounted for two-thirds of Canadien trips to Europe. However, less traditional European destinations like Greece, Finland and Croatia have been making significant inroads into the Canadian market. Primarily chosen as a summer vacation destination, Europe welcomed 6.2% more Canadian visitors in the winter of 2015-2016, compared to the previous winter.

canadian_arrivals_destinations_2014_2015_figure_4

Independent travellers

Canadians are primarily independent travellers (FIT), opting for personalized itineraries rather than organized programs. For Canadian travellers, the purpose of stay in Europe is not the same as that for other destinations. While 14% of trips to the United States are taken to visit friends and relatives, this proportion rises to 38% in the case of travel to Europe. In addition, the percentage of Canadians travelling for business is higher in Europe than elsewhere.

canadian_travel_purpose_stay_figure_5

Drivers of growth

Several elements will drive the growth of Canadian outbound travel in the coming years:

  • Although it is modest, Canada is in a period of economic growth.
  • Baby-boomers , which represent a significant portion of the population (29%), are gradually retiring. These individuals have a lot of discretionary income and want to travel.
  • The demand for travel to visit friends and relatives is high among Canadian residents from various ethnic communities who travel to their country of origin.
  • Canadians are familiar with digital marketing and are among the most active populations on social media. Destinations are using effective measures in the field of digital technology to increase their promotional efforts, which should stimulate Canadian outbound travel.

Image on first page: ©StockSnap

Catégories
Facts and figures Geographic markets

Global ranking of destinations and source markets

The flow of tourists to various destinations around the world has changed drastically in recent years and data compiled over the past decade corroborates certain trends. New outbound markets occupy the top spots and the ranking of destinations has been turned upside down. Emerging economies are profoundly altering the global tourism market, which is now shared amongst a much greater number of countries than before.

According to World Tourism Organization (WTO) estimates, the number of international tourist arrivals reached 940 million in 2010, or a 39% increase over 2000. Seen over the longer term, growth has been exponential; only 25 million tourists travelled in 1950.

Since the WTO compiles national statistics, methodologies may vary. For this reason, results must be interpreted with caution. In addition, results for the year 2010 were estimated based on partial data.

Top-ranked destinations

Not only has the ranking of destinations changed dramatically over the years, the sheer number of countries visited by tourists has increased tremendously. Here are some interesting observations about the number of international arrivals at the most popular destinations (Table 1):

  • The top 5 countries in the ranking accounted for 71% of all arrivals in 1950, and only 31% in 2010.
  • The “Other” category, which represents the next ten destinations in the ranking, accounted for only 3% of arrivals in 1950, but rose to 34% in 1990 and 44% in 2010!
  • Canada’s ranking dropped from 2nd in 1970 to 8th in 2000, and finally to 15th in 2010.
  • China is not only a very active outbound market; it has also become an extremely popular destination.
  • Malaysia, Turkey and Hong Kong have made major inroads into the tourism market.
  • The tourism sector has been demonstrating its resilience for over 60 years.

The top six destinations have remained been more or less the same since the year 2000. France enjoys a comfortable lead and China – which outranked Spain in 2010 – is now closing in on the United States. Canada has not been one of the top ten destinations since 2004.

Graphs 1 and 2 illustrate, respectively, the top 20 destinations by international tourist arrivals and by international tourism receipts. The two rankings differ somewhat. In terms of tourism receipts, the United States is in the top position, well ahead of second-ranked Spain, which also outranks France. While some countries occupy similar rankings in both graphs, others appear in one and are completely absent from the other. Countries that rank in the top 20 of arrivals but not in receipts are the Russian Federation (27th), Poland (30th), Ukraine (50th), Greece (21st) and Egypt (22nd). Conversely, some countries have high tourism receipts for a relatively lower number of visitors: the Netherlands (21st), Switzerland (28th), Japan (29th), Australia (41st) and India (42nd).

In fact, not all countries have benefitted from the overall growth in international tourist arrivals. Graph 3 illustratesthe change in arrivals for various countries. While some have more than doubled the number of arrivals, others, like Canada (-18%) and Poland (-28%), have recorded major decreases.

Where do most travellers come from?

Europe is currently the top source market for tourists, generating 55% of all international tourists, followed by Asia and the Pacific (20%) and the Americas (16%) (Table 2). Asia and the Pacific, the Middle East and Africa recorded the strongest average annual growth rate for the period covered. The majority of international visitors, approximately four out of five, travel within their own region. However, it would appear that the number of trips from one region to another has increasedat a faster rate than the number of intraregional trips. Industrialized countries remain the primary source markets of international tourists. However, with the increase in disposable income, many emerging economies have experienced higher growth rates in the past few years.

The data in Table 3about tourist-generating countries is expressed in terms of international tourism expenditures, as published by the WTO, not in terms of number of trips. Total spending grew from US$478 billion in 2000 toUS$678 billion in 2005and to US$850 billion in 2009, for an overall increase of 78%. In 2009, source markets saw their international tourism expenditures fall 10% compared to 2008, due to the economic crisis and the H1N1 flu. In 2000, only 10 countries recorded international tourism expenditures of at least US$10 billion, while 23 countries did so in 2009.

The top three spots have been occupied by Germany, the United States and the United Kingdom since 2000, with France, Italy and Japan following close behind.The explosive growth of the Chinese travel industryhas pushed it into the top five even though its population has only just begun to travel. Chinabegan signing agreements in 1999 to permit leisure travel to various countries, but Canada has only very recently obtained the status of an authorized destination (June 2010). The Chinese still travel a lot within their own country, but the proportion of domestic trips to those outside the country has risen from 71 to 1 in 2000 to 38 to 1 in 2009.

Japan is the only country in the ranking below to have reduced its international tourism expenditures. Hard-hit by economic woes and fuel prices, the population has lost some confidence and travels less than before.

The Russian Federation, Saudi Arabia, Belgium, Australia, Singapore, Norway and Brazil more than doubled their spending during this period.

In short, the tourism market is constantly changing and welcoming more participants so it is easy to get lost in the crowd. The good news? The number of tourists from various regions around the world is growing constantly. We live in an age where physical distances are less intimidating than before and where tourists are choosing to travel just about everywhere. We must design our tourismstrategies to reflect a broader geographic perspective and not be afraid to compete with top-ranked destinations.


Sources:

– World Tourism Organization. “World Tourism Barometer, Interim Update April 2011.”

– World Tourism Organization. “Tourism Highlights, 2009 Edition.”


Catégories
Geographic markets Trends

Global Tourism: Black Clouds with Silver Linings

Stormy Skies on the Horizon

The global economy has fallen off a cliff and no one is sure when it will hit bottom. According to the International Monetary Fund (IMF), the world’s advanced economies experienced an unprecedented 7.5% decline in real Gross Domestic Product (GDP) during the fourth quarter of 2008. The IMF projects a similar drop for the first quarter of 2009 and says Euro zone GDP will fall more than 4% for the year. In 2009, the world economy will contract for the first time since the Great Depression.

The world’s largest economies are particularly challenged. GDP in the United States has contracted at an annual rate exceeding 6% for the last two quarters. The IMF forecasts that Russia and Japan will see GDP shrink by a similar amount through 2009. Japan’s export-driven economy will experience its first-ever trade deficit and the country will likely experience a dangerous deflationary spiral.

Fragile Tourism

Travel and tourism are particularly sensitive to macroeconomic developments.  The United Nations World Tourism Organization (UNWTO) reported a year-on-year drop in international tourist arrivals for the second half of 2008.  Asia and Europe experienced particularly steep declines of 3%.

The current year got off to a frightening start with international travel agents and tour operators reporting substantial declines in reservations for the coming summer season.  The US hotel industry is suffering massive losses as both occupancy and room rates dive precipitously.  In New York, March revenue per available room (RevPAR) dropped 35.5% on a year-on-year basis.  RevPAR in Orlando and Miami declined by 28% and 29%, respectively.

Two Canadian provinces, New Brunswick and Prince Edward Island, finished 2008 with average hotel occupancy at a paltry 45%. Both provinces are forecasting further demand deterioration this year. Some Canadian urban markets are faring even worse. Annual hotel occupancy for Niagara Falls’ 10,000 hotel rooms was just 38% with no improvement foreseen this year.

Asian powerhouse markets have also been devastated.  Chinese and Indian hotels reported March year-on-year RevPAR declines of 35% and 40%, respectively.  The Thai market, complicated by political unrest, witnessed a RevPAR drop of 37%.  While globalization ignited the twentieth century international tourism boom, it also eliminated firewalls that could have contained the economic contagion ravaging the travel and hospitality industries.

The Upside of a Downturn

With so much gloom on the economic horizon, many business executives are suffering from managerial catatonia. Conventional wisdom dictates that opportunities abound in surging markets, while recessions oblige businesses to hunker down and weather the storm. In contrast, Professor Don Sull, my colleague at London Business School, has become a guru of sanguinity by suggesting that the most lucrative business opportunities are present during economic downturns.  Professor Sull’s research argues that it is significantly easier to implement organizational change and instil better practice in stressful recessionary markets than in boom times. He explains how managers can harness a downturn to identify lucrative investment opportunities, renew a sense of urgency, justify unpopular decisions and overcome complacency (www.donsull.com).

Applying Sull’s hypothesis to the tourism industry during the gravest financial crises of the last century can be an insightful exercise.  Entrepreneurs, investors and managers have frequently identified silver linings in dark economic clouds.  The following three examples illustrate how travel and hospitality professionals have seized opportunities during economic recessions of the past.

Case 1: The Waldorf-Astoria

Hotelier Lucius Boomer opened New York’s Waldorf-Astoria on October 1, 1931, in the midst of the Great Depression.  Towering 42 stories above Park Avenue with almost 2000 rooms, it was the largest and most expensive hotel ever built.  With equity markets in shambles and a quarter of the US population unemployed, few were the fools who expected the hotel to remain open for long. Stock markets had been declining for two years and there was no end to the economic turmoil in sight.

In spite of the gloomy discourse, the opening of the Waldorf-Astoria manifested how the Great Depression had radically altered a fundamental business paradigm. Boomer focussed on depressed costs to attain a competitive advantage. He capitalized on the idle construction sector to negotiate favourable building contracts.  The cost of previously expensive finishing materials had plummeted, permitting use of the finest marble, granite, hardwood and brass.  Unemployed artisans and craftsmen were brought from Europe to work on the hotel interiors at a fraction of their pre-Depression wages.  In the end, a palace was built on a pauper’s budget.

President Herbert Hoover inaugurated the Waldorf in a radio address on the eve of its grand opening. “Our hotels have become community institutions,” said Hoover.  “They are the central points of civic hospitality … The erection of this great structure has been a contribution to the maintenance of employment and an exhibition of courage and confidence to the whole nation.”

The Waldorf-Astoria was also an extremely lucrative investment.  By the mid-1930s the hotel was filling its suites with presidents, royalty and captains of industry.  While the value of the Waldorf’s real estate, management contract and goodwill are debatable, it is probably the most valuable hotel in the world today.  In the end, it was the economic conditions of the Great Depression that permitted the Waldorf to have been built in all its glamour and glory.

Case 2: Carnival Cruise Lines

Most tourism professionals would hesitate to consider the economic turmoil of 1974 the ideal business climate in which to found a capital-intensive enterprise in an industry sector heavily dependent on discretionary spending by retired senior citizens.  Following the breakdown of the Bretton Woods system, US GDP was contracting and inflation exceeded 12%.

In the face of this economic ataxia, Ted Arison purchased a distressed cruise ship for one US dollar and the assumption of $5 million in debt.  In November 1974, with the Dow Jones Industrial Average down 45% from its previous year high, Arison registered the Carnival Company as owner and manager of Carnival Cruise Lines.

At the time, it was difficult to understand why Arison, a savvy businessman, would purchase a near-bankrupt cruise company on the heels of the Arab oil embargo. Petroleum prices had recently quadrupled and a cruise ship could burn up to 200 litres of fuel per minute.  On the surface, the deal made no economic sense.  Arison had different ideas, however. He was about to revolutionize the cruise industry.

Arison targeted a younger market segment (25-40 year olds) that had considered ocean cruises a leisurely pastime for the geriatric set.  Carnival’s ship was redecorated in a flashy neon-esque style. An onboard casino and discotheque were added. Marketing imagery turned away from elegance and genteelness in favour of youthfulness and frivolity. Micky Arison, Ted’s son, made sales calls on dozens of travel agents, employing a casual youthful style to convince them that cruises would be the next big holiday trend for young adults.

Within a year, Carnival was operating at 100% capacity.  It went on to become the world’s largest cruise line. By identifying opportunities in a downturn, Arison’s one dollar investment made him a multibillionaire.

Case 3: Emirates Airlines

Following the September 11, 2001, terror attacks in the United States, the global travel industry came to a screeching halt.  Airlines and hotels were besieged with reservation cancellations. Looking longer term, air carriers began to cancel aircraft orders.  Share prices for Boeing and EADS (Airbus’ parent company) plummeted.

Ahmed Bin Saeed Al-Maktoum, Chairman of the Emirates Group, sensed an opportunity where his competitors saw a threat. No one knew how long the downturn would last but Sheikh Ahmed knew that Emirates was well positioned for growth in the long term.  At the lightly attended Dubai International Air Show in October 2001, the Emirates Chairman negotiated with Boeing and Airbus for an enormous aircraft order.  In an attempt to defend market share as order cancellations poured in, the two manufacturers offered deep discounts.

Emirates ended up splitting the order between the two companies, buying US$15 billion worth of airplanes. While the purchase was more than originally anticipated, Sheikh Ahmed later explained that fire-sale prices resulting from the economic downturn were too attractive to forego.

While delivery of the aircraft would take place over several years, client and investor confidence was immediately apparent.  In the airline industry’s worst ever year, the Emirates Group finished the 2001-02 fiscal exercise with net income representing 8% of revenue. The airline paid a substantial shareholder dividend and a bonus payment of 3 weeks salary to all employees. While competitors laid off large numbers of staff, Emirates did not make a single employee redundant and paid salary increments in full. Among numerous awards, Emirates was voted “Airline of the Year 2002” by 4,000,000 Internet users in the second annual Skytrax Research Study and Best Cargo Airline to the Middle East by Air Cargo News. By considering long-term strategic opportunities, Emirates seized the upside of a downturn.

So where are the opportunities?

Some hospitality businesses are less affected by broad economic strife than others. In comparison to many restaurant companies, McDonald’s Corporation has held up well over the last year. It is ranked as the fourth best performer on the Dow Jones Industrial Average. Its share price is down just 9% compared to the DJIA average of -38%. The company had sufficient confidence in its short-term performance to increase its 2008 fourth quarter dividend by 32%.

McDonald’s is capitalizing on Starbuck’s misfortunes to launch McCafe, a quick service restaurant concept offering cappuccinos, lattes and mochas. With Starbuck’s closing nearly 1000 units, McDonald’s is betting it can attract consumers specifically to purchase specialty beverages rather than just as a support for its food offerings.

Lucrative long-term investment opportunities also exist in the lodging sector. While the number of portfolio and single asset hotel transactions has dropped significantly over the last year, investors with access to capital have been purchasing properties at deep discounts.  The United Kingdom, in particular, has witnessed the liquidation of premium hotel assets at prices that would have been shocking two years ago.  Distressed companies like Royal Bank of Scotland and hospitality giant Mitchells & Butlers have been obliged to sell hotels to generate desperately needed cash.

In a market frozen by the credit crisis, Britain’s Travelodge has been on a buying spree, picking up six properties (650 rooms) from Menzies for £85 million, seven Swallow Hotels (669 rooms) for £70 million and five independent hotels (500 rooms) for £35 million.  Travelodge is opportunistically fleshing out its geographic coverage with aspirations of dominating the British budget sector when the country emerges from its current downturn.

New Eyes

In challenging economic times it is difficult for business leaders to see the light at the end of the tunnel. Indeed, it is even harder to identify opportunities at hand. As such, failure can be a self-fulfilling prophecy.  A Chinese proverb advises that “If we don’t change our direction, we’re likely to end up where we’re headed. »

In challenging times, it is critical that managers in the travel and tourism industry recognize existing business opportunities. There is a silver lining in most black clouds.  As illustrated in the three cases presented herewith, the challenge is not seeking new opportunities but having new eyes to identify them.

Catégories
Facts and figures Geographic markets Issues

Dollar (dis)parity is only part of the problem

Now the Canadian dollar has reached parity with its US counterpart, many questions are being raised. Without doubt, Canada’s performance in the American tourist market has been disappointing in recent years and the inexorable rise of the Canadian dollar in 2007 has only increased the level of anxiety in our industry. However, is our tourism deficit closely tied to the vagaries of the exchange rate? Is it a given that the flying loonie will aggravate our poor performance? By examining the issue from a broader perspective, we find that the reality is much more complex. We shouldn’t be too quick to blame all our tourism woes on the dollar exchange rate.

Concerns for the US market

The rise of the Canadian dollar in relation to that of Uncle Sam has been truly spectacular over the past five years. In 2002, the exchange rate for US$1.00 was CN$1.57 (average annual rate). For many years, the exchange rate was one of the incentives used to attract our neighbours from the south with slogans like “Stretch your dollar!” Clearly, the dollar’s sudden parity is of great concern, given that stakeholders across the board are looking for ways to stimulate this declining market, so key to the health of our tourism industry.

Since 2002, a record year for the number of American tourists in Canada, the numbers have been falling steadily, apart from a brief respite in 2004. And yet, is the exchange rate truly the prime culprit? Have we overestimated its influence on the travel behaviour of Americans?

The situation elsewhere

To better understand and put into perspective how the exchange rate truly affects the travel decisions of Americans, we have compared changes in the value of the loonie with those of other currencies (see Figure 1). We have examined fluctuations in the US dollar since 1995 in relation to the Canadian dollar, the euro, the Mexican peso and the Japanese yen. At the same time, we have charted the annual number of US citizen international departures to Canada, Mexico and overseas. To make the data comparable, we have established 1995 as the reference year, with an index of 100. The lines in the graph below illustrate the increases and decreases noted in relation to the reference year.

CP_2007-09_taux_change_grphq1

This graph shows the decline of the US dollar in relation to the Canadian dollar (red line) is much more dramatic than the drop in the number of American tourists to Canada (broken red line). The departures in question refer to stays of one night or more, as day trips have, in fact. recently dropped more precipitously.

Venturing further afield

It is a mistake to believe Americans no longer travel due to a combination of factors like a weak currency, security concerns, a turning inward, etc. The line tracking the number of Americans travelling overseas (broken blue line) eloquently shows that Americans are more interested than ever in discovering new destinations. For example, according to a survey of AAA travel agencies, reservations for US travellers to Eastern Europe jumped 55% in the summer of 2007.

Though there was certainly a temporary drop in the period immediately following 9/11, interest in far-flung destinations rebounded as of 2003. In fact, the euro is the most relevant currency in the analysis of how exchange rates influence US travel abroad (though we have included the yen for information purposes). Like that of the Canadian dollar, the euro’s value has appreciated significantly (dark blue line) vis-à-vis the US dollar since 2001. And yet, during the same period, the number of international departures from the US increased dramatically.

The example of Mexico

Mexico is a very interesting case because its geographic proximity to the US is similar to that of Canada. Unlike the Canadian dollar, the Mexican peso has been falling steadily in value against the US dollar since 1995 (green line). However, this growing purchasing power has not affected the decision to travel to Mexico, with the number of US tourists to the country remaining relatively flat (broken green line).

A closer look at two other indicators

A basic notion in economics is the idea of “All other things being equal.” This is often used as a premise when analyzing economic phenomena. However, in real life, all other things are never equal, a caveat that must be kept in mind when referring to the analytical model presented in Figure 1.

CP_2007-09_taux_change_grphq2

The travel intentions of citizens are often tied to their country’s economic performance. For this reason, we felt it was interesting to compare the change in the number of American tourists travelling to Canada and overseas with two other economic vectors: the level of personal consumer spending (purple line) and the price of gas (yellow line).

Without doubt, skyrocketing gas prices do nothing to encourage proximity tourism among Americans who usually travel to Canada by car. Over the past few years, the drop in the number of these travellers has been much more pronounced than the decrease in air travellers.

The change in US personal consumer spending is another interesting indicator of Americans’ ability and desire to spend. In fact, the graph shows that the significant increase in international departures is more or less in step with the spending indicator. Though our analysis may not be truly scientific, it does illustrate that Americans’ travel interests are evolving to the detriment of Canada.

Better understand the impact

Surveys show that the exchange rate can influence travel intentions, particularly among certain customer segments. When it comes to international travel, Americans demonstrate a lower sensitivity to currency fluctuations than Canadians.

Certain outside factors can enhance the potential impact of currency fluctuations. One such factor in particular is the media coverage lavished on the phenomenon; it would seem the Canadian media is more interested than the American media in the rise of our dollar.

It is also true that although Americans may not be very aware or influenced by the loss of their purchasing power, they definitely feel it once they reach their destination. The firm Moneris Solutions has studied US credit and bank card transactions at Canadian merchants. Total transactions in US dollars dropped in July and August 2007 compared to the same period in 2006.

This study did not take into account the number of visitors involved. Nonetheless, the numbers do indicate that spending budgets have dropped in a greater proportion than the number of American tourists. Other factors like falling room prices in 2007 also had an affect on the expenditure base. The study reveals the sectors most severely affected: specialized retailers (-35%), campgrounds and trailer parks (-22%), public golf courses (-14%), hotel reservations (-13%), bus travel (-13%) and restaurants (-8%)

A major challenge

Canada’s current difficulty recovering its share of the American market is deep-rooted and not due solely to economic factors. Other studies have reached the same conclusion: Americans no longer find Canada as attractive as they once did and would prefer to set their sights on new destinations. An unfavourable exchange rate and high gas prices are merely additions to the list of deterrents, particularly when it comes to proximity tourism. Now that our currency has reached parity, we must use innovation and an enriched tourism supply to change their minds!

Sources:
– Montet, Virginie. “Les touristes américains découvrent l’Europe de l’Est,” La Presse, September 26, 2007.
– Office of Travel & Tourism Industries.
– Turner, Riva. “US Spending in Canada Sees Significant Decline,” Moneris Solutions [www.moneris.com], September 24, 2007.
– US Census Bureau.

Catégories
Facts and figures Geographic markets

Antarctica 2006-2007: Another record-breaking season ahead

A Tourism Intelligence Network expert specialized in polar tourism, Alain A. Grenier sketches an overview of the Antarctica tourism industry. A PhD in Sociology and formerly an associate professor at the University of Lapland in Rovaniemi, Finland, he is now a professor in the Department of Tourism and Urban Studies at the UQAM School of Business Administration.

With the arrival of the austral summer in November, tourists – more specifically, cruise passengers – are once again heading to Antarctica.

The majority of Antarctic cruises take place in the Peninsula area, which is blessed with a less severe climate and a greater diversity of attractions (i.e. fauna, flora and a large number of scientific bases and historic sites). In contrast, the other tourism area, the more remote Ross Sea region, features almost exclusively historic sites.

In addition to the more traditional cruise programs combining observation and hikes ashore, a variety of new activities have started to appear in recent years, including scuba diving, sea kayaking, rock climbing, skiing, snowboarding and camping. It is impossible to say, at this point, if these new activities are the result of the arrival of younger and more active visitors, or if the new tourism profile is emerging in response to the products offered by tour operators. What is certain, however, is that Antarctic tourism is growing.

Figures

Compared to the last austral summer (2005-2006), the number of cruise tourists has risen by 12%(4) . This year, the International Association of Antarctic Tour Operators (IAATO), which represents 95% of the organizers involved in Antarctic tourism, expects nearly 38,000 visitors to Antarctica from mid-November to early March(4):

  • 27,575 tourists will participate in an Antarctic cruise with shore excursions (mainly in the Peninsula area)
  • 7,500 tourists will take part in a cruise only (no shore excursion)
  • 1,050 tourists will purchase a land tour (skiing, alpinism, etc., in the Antarctic’s interior)
  • 1,600 tourists will participate in a sightseeing flight (these flights, generally based in Australia, do not land on the continent and involve large planes like the Boeing 737-200 and 747-400, flying at about 2000 feet (610 m) above the Antarctic coast)

More than any other, polar cruises continue to dominate the Antarctic tourism market, with the number of passengers increasing year after year (Figure 1).

Figure 1

Source: IAATO (2006b)

While polar cruise tourism will continue to increase in the Antarctic Peninsula during the 2006-2007 season, the number of visitors to the Ross Sea region is expected to decline slightly(4). Compared to the 42 million visitors who entered the United States in 2004(7), the data regarding tourism in Antarctica – a continent 30% larger than the surface of the USA, may appear insignificant. To understand the importance of the figures presented above, it is necessary to put them into the proper polar tourism context.

A sensitive continent

Antarctica is a continent like no other. This continent, the only one without an indigenous human population, also has extremely limited surface flora and fauna (in species diversity). In summer, when the seas surrounding the polar continent are free of ice, Antarctica and its Sub-Antarctic islands cover an area of 13.6 km2. More than 98% of the continent’s surface is permanently hidden under a cover of ice(1)(3). This ice sheet – the biggest on Earth – may reach a thickness of up to 4.7 km in certain areas and contains no less than 90% of the plant’s fresh water reserves(3).

Tourism, like most other human activities, takes place during the very brief polar summer. This is also the reproduction season for most of the continent’s animal species, which are very abundant at this time of year. As a result, the less than 2% of Antarctic and Sub-Antarctic island lands free of ice and snow become very precious for both fauna and visitors (scientists and tourists alike). In such a context, there is a very good chance that fauna (and, to a lesser degree, flora) could be negatively impacted. The scientific community, however, remains divided over the extent of this impact.

Negative Impact

In addition to the pollutants released when tourism vehicles (ships, inflatable boats, helicopters, large and small airplanes) burn fossil fuel, the main disruptions directly attributed to tourism activities include soil disturbances (more limited in the Antarctic than in the Arctic) and fauna harassment (mainly birds). It is important to stress, however, that atmospheric pollution remains the biggest threat to polar ecosystems. Apart from the pollution caused by burning fuel to transport tourists, most of the air pollutants affecting Antarctica are produced outside area and can therefore not be attributed directly to tourism.

Trying to protect the very resources the industry depends upon, the IAATO has created a visitor’s code of conduct entitled « Guidance for Visitors to the Antarctic. » This recommends, among other things, the distances one should respect when observing the various fauna species. In the past, some observers(2)(6) have stressed that the guidelines are not applied consistently. The problem is that the code is enforced by guides, who must also see to their customers’ satisfaction. Many of these customers have a hard time containing their enthusiasm once ashore. Other visitors, who have invested considerable sums of money to reach these natural areas, sometimes feel they have earned the right to approach wildlife beyond the distances allowed. According to IAATO(4), however, the activities of its members have « no more than a minor or transitory impact on the Antarctic environment. »(4)

The organization worries, however, about the 5% of Antarctic operators who have not joined IAATO and therefore do not apply the visitors’ code of conduct. During the 2005 2006 austral summer, 4,639 visitors and an unknown number of small boat passengers set foot on Antarctica with no public record of their visit (4). In its annual report, IAATO(4) expressed concern over two non-member vessels, each carrying 500 passengers, who made shore excursions in spite of the IAATO regulation limiting site access to ships carrying more than 200 passengers.

The tourism forecasts made by IAATO for the 2006-2007 austral summer indicate that the travelling public’s desire for Antarctic adventures knows no limits other than those imposed by the number of ships and places available for such journeys. Negative impacts, as well as incidents involving tourism activities such as the sinking of the Bahia Paraiso in 1989, remind us, however, that tourism growth in such a remote and isolated place as Antarctica requires safe, sustainable management approaches.

Sources:
(1) – Cessford, Gordon (1997) « Antarctic Tourism – A Frontier for Wilderness Management, » International Journal of Wilderness, Vol. 3, No. 3, USA, pp. 7-11.
(2) – GRENIER, Alain A. (1998) « Ship-Based Polar Tourism in the Northeast Passage: A Case Study,  » Publication in the social sciences, University of Lapland, Rovanieni, Finland.
(3) – HANSOM, James D. and GORDON, John E. (1998) « Antarctic Environments and Resources – A Geographical Perspective, » Longman: UK.
(4) – IAATO (2006a) « IP 86 IAATO Overview of Antarctic Tourism 2005-2006 Rev 1, » International Association of Antarctic Tour Operators (Website), 21 p.[www.iaato.org/info.html]
(5) – IAATO (2006b) « Tourism Statistics, Trends 1992-2007, » International Association of Antarctic Tour Operators, [http://image.zenn.net/REPLACE/CLIENT/
1000037/1000116/application/msword/Trends1992-2007.doc
]
(6) – VUILLEUMIER, François (1996) « Negative Impact of Tourism on Antarctic Animals and Plants, » Southern Connection Newsletter, July, No. 10.
(7) – WTO (2005) « Tourism Market Trends, 2005 Edition, Annex, » World Tourism Organisation. [http://www.unwto.org/facts/menu.html]

Catégories
Facts and figures Geographic markets Management

Number of tourists or tourism revenues?

Should tourism-industry growth be measured in international arrivals or in economic benefits? Which category would we rather be performing best in? Where does Canada stand in the stats? In a country-by-country comparison, we realized we were on the wrong track in trying to analyze the increase in international tourism revenues in 2004 compared to 2003.

Baffling figures

The World Tourism Organization (WTO) reported that – after declining for three consecutive years – international tourism revenues rose 9% in 2004, while also making it clear that this increase was expressed in local currencies at constant prices, thus neutralizing the effects of exchange rate fluctuations and inflation.

When you look at the 2004 growth of international tourism revenues over 2003 in US dollars (WTO statistics), there is much to be amazed by!

  • Worldwide, the increase was 18.8%.
  • Asia-Pacific posted an increase of 31.8% and the Middle East 24.8%.
  • In Europe, only one country (Hungary) posted growth of less than 10%.
  • In Asia-Pacific, a majority of destinations (12 out of 15 countries) experienced an increase of more than 20%.
  • Canada can be thrilled with a 21.8% increase in tourism revenues.

However, when you look at the 2004 growth of international tourism revenues over 2003 in euros (WTO statistics), there is much to be disturbed by!

  • Worldwide, the increase was 8%.
  • Asia-Pacific posted an increase of 19.8% and the Middle East 13.5%.
  • In Europe, only two countries (Ukraine and Poland) posted growth of more than 10%.
  • In Asia-Pacific, just under half the destinations (six out of 15 countries) experienced an increase of more than 20%.
  • Canada did well with a 10.7% increase in tourism revenues.

In light of these statistics, it becomes difficult to compare revenue growth rates among countries. In effect, if the yen gained more ground against the euro over the year than the Canadian dollar did, the growth rate reflects the change in the exchange rate as much as the change in revenues. It would be fairer and more illuminating if the revenue statistics were produced in local currencies and constant prices.

In which category do we want to perform best?

France was the No. 1 destination in the world in international arrivals, but third in tourism revenues. And not only did France post the worst showing in terms of average spending per international arrival among the top 12 revenue-makers, it performed worse than many other destinations as well. Conversely, the US was third in arrivals, first in revenues, and did very well in average spending (Table 1).

Unfortunately, the lack of statistics on such factors as length of stay prevents a more precise picture of the situation. But other interesting points emerge from juggling the statistics (tables 1 and 2):

  • The US had 38% fewer arrivals but 45% more revenues than France. The tourist visiting the US spent three times more than in France, or $1,616 US versus $544 US.

  • The US and Germany did well in all three categories (revenues, arrivals and average spending).

  • In 2003, Australia was the top performer in average spending, according to the statistics (4.4 million arrivals, $10.3 billion US in revenues, average spending of $2,370 US). In 2004, it was in 10th position in revenues, but did not make it into the top 20 in arrivals (the Netherlands was in 20th place, with 9.6 million). It essentially posted the same revenues as Canada, with four times fewer arrivals than Canada.

  • Japan and Belgium (2003 arrivals data) were in the top 20 in revenues (in 20th was Malaysia, with $8.2 billion US), but did not make it into the top 20 in arrivals. Their ratio of average spending was obviously very high.

  • Although they didn’t make it onto the list of top 20 revenue earners, many countries (Table 2) managed to turn in better performances on average spending than some of the top 20 revenue-earning countries.

  • Hong Kong, Poland, Hungary and Ukraine, all in the top 20 in arrivals, fared poorly in average spending, at less than $500 US.

  • Despite six million arrivals, Tunisia did not manage to generate substantial economic spin-offs, with average spending of just $318 US per international arrival.

  • With average spending of $702 CAD in 2004 (3.3 million foreign tourists and 2.3 billion CAD in revenues), Quebec surpassed the Canadian average.

What should we conclude?

When figures show France can be proud of recording 75 million international arrivals but that it managed to obtain an average spending rate of only $544 US, you have to ask yourself if the statistics speak for themselves, if they should be challenged, if information essential for accurate analysis is missing, if the methodologies were consistent?

An analysis of the data leads to the conclusion that more arrivals do not necessarily equal more revenues. In this vein, many countries would like visitors to spend more.

In the UK, the Office for National Statistics recorded an 11% increase in tourists in 2004 (27.3 million) compared to 2003, and an 8% gain in revenues (£12.8 billion). Despite these positive results, VisitBritain is obviously working to raise visitor numbers, but in particular to boost how much they spend.

Among the leading destinations, Italy had a relatively poor 2004 compared to 2003. The 2.2% dip in the number of overnight stays (336.8 millions) and the 2.4% decline in the average length of stay (4.06) cast a shadow over the revenue picture.

The situation was similar for tourism professionals in Spain, where « fewer tourists and more profitability » has become the new credo of major hotel chains and others in the industry. Government officials also feel it would be better to have fewer tourists, but for longer stays. Visitors numbers advanced 3.4% in 2004 (53.6 million), but revenue volume did not keep pace, constituting a drop in average spending.

In Quebec, the Association touristique régionale (ATR) de la Gaspésie faced a similar situation: while tourist numbers rose, visitors were not staying as long or spending as much as previously. To counter the problem, the ATR increased its presence in promotional markets, invested in training programs based on the client approach, and launched a « Quality » initiative.

Obviously, the methodology and recording of data can differ from country to country, making comparisons difficult. But beyond the figures, the question remains interesting: is the goal to attract more tourists with all the consequences of that, or is it to increase economic benefits in a perspective of sustainable development?

Sources:

– Alves, Jose. « L’Espagne remet en cause son modèle touristique, » Les Échos, No. 19338, January 27, 2005, p. 26.
– McGrath, Ginny. « Britain Needs Big Spenders, » Travelmole, February 9, 2005.
– World Tourism Organization. « Tourism Highlights, » 2005 edition.
– Voilà.fr. « L’Italie a connu une mauvaise année touristiques en 2004, » [www.voila.fr], February 11, 2005.

Catégories
Facts and figures Geographic markets

American tourists: Where have they gone?

In 2004, Americans once again began travelling to foreign destinations in large numbers, but they seem to have ignored Canada. The number of U.S. international tourists ?all destinations combined ? reached a record high of 61.8 million that year, surpassing the previous record set in 2000. And yet, since the new millennium, Canada has noted a significant decline in the number of U.S. visitors. From 2000 to 2004, this figure fell 21.3% and preliminary data for the January to October 2005 period show a decrease of 8.7% compared to the same period in 2004.

Fewer U.S. visitors to Canada

The marked decline in the number of Americans travelling to Canada is of concern to the entire tourism industry, although the drop has not affected all the provinces in the same way. In fact, from 2000 to 2004, compared to the other Canadian provinces, Quebec appears to have been less affected by the Americans’ decision to desert Canada.

If we do a monthly comparison of U.S. arrivals to Canada in 2000 and 2004 (Graph 1), the slump is proportionally less significant during the summer months (June: -18.8%, July: -16.5% and August: 19%). However, in absolute numbers, losses are the highest during the months of the high season (July: 981,777 visitors and August: -1,079,657 visitors).

Major drop in same-day visitors

It is important to note that 98% of the decline in U.S. visitors to Canada is due to a sharp drop in same-day visitors, a situation that affects Ontario in particular since this province welcomed three-quarters (74.4%) of the total U.S. same-day visitors in 2000 (Table 2). From 2000 to 2004, the number of same-day visitors to Ontario fell by over 7.5 million.

Therefore, if we look solely at the number of tourists (Graph 2), the decline in the U.S. travel market is much lower, proportionally speaking. In fact, from 2000 to 2004, the number of Americans spending one night or more in the country dropped a mere 1.11%. During the same period, Quebec even recorded an increase of 3.38%.

2002: Base year or exception?

In 2002, Canada welcomed a record high of 16.17 million U.S. tourists. This increase of nearly 650,000 tourists compared to 2001 occurred at a time when the number of U.S. travellers to international destinations plummeted 1.3 million. Of course, this extraordinary performance can be explained, in part, by the public’s reaction to the events of 2001: travellers sought safety by staying close to home.

The 2002 increase was fuelled primarily by a jump in leisure travel since the number of business tourists in this record year only reached 1.96 million, a decrease compared to the 2.16 million recorded in 2000 (Graph 3). Furthermore, for the past several years, business travel has made up a proportionally smaller share of Canada’s U.S. travel market.

2005: The true decline begins

Preliminary data for the year 2005 (January to October) illustrate a trend of concern to the entire Canadian tourism industry, particularly that in Quebec.

This drop appears to be due to border markets, because in the first ten months of 2005, the number of American tourists arriving by car dropped 13.5%, while the number of those using other modes of transportation increased 6.4%.

Americans travelling to see the world

In 2004, Americans travelled abroad as never before, surpassing the record set in 2000 (61.8 million vs. 61.3 million). However, during this same period, Canada recorded a decrease of nearly 175,000 U.S. tourists. An analysis of the regions visited (Table 4) demonstrates a major shift in the international travel habits of Americans.

According to Table 4, non-traditional destinations are enjoying an upswing in interest on the part of American travellers. At the same time, traditional destinations (Canada, Mexico and Western Europe) saw their market shares drop sharply from 2000 to 2004 (Graph 4).

Preliminary data from the U.S. government for the period January 1 to September 1, 2005, show that U.S. air traffic to overseas destinations rose 5%. Once again, Central America (+14%), Asia (+10%), South America (+9%) and the Middle East (+8%) recorded increases superior to that of Europe (+3%).

The Canadian tourism industry, which still hopes to repeat the success of 2002, must accept that things will never get « back to normal » because American and global realities have been so profoundly altered.

The situation according to the Canadian Tourism Commission (CTC)

In the fall of 2005, the CTC formed a task force to examine the U.S. market. Its preliminary findings seem to confirm that Canada cannot blame factors like SARS, the war in Iraq, exchange rates or border-crossing issues for the country’s failure to attract U.S. tourists. The Americans interviewed by the CTC note that while they have no specific reasons for staying away from Canada, they are not motivated to come here either. This means that Canada is not successfully distinguishing itself from other destinations in an increasingly competitive field. The CTC’s final report is expected in late January 2006.

Sources:
– Canadian Tourism Commission. « US market taskforce expands mandate, » Tourism, Vol. 002, Issue 11, November-December 2005.
– Ontario Ministry of Tourism and Recreation. « Regional Tourism Profile – Provincial Markets Shares », www.tourism.gov.on.ca/english/tourdiv/research/rtp/2003/
ComparitiveReportsProvinces/index.html

– Statistics Canada. “International Travel Survey,” Catalogue No. 66-001-PIB, January 2000 to October 2005.
– U.S. Department of Commerce, ITA, Office of Travel and Tourism Industries. “U.S. Citizen Air Traffic to Overseas Regions, Canada; Mexico 2005,” www.tinet.ita.doc.gov, 2005.
– U.S. Department of Commerce, ITA, Office of Travel and Tourism Industries. « U.S. Resident Travel Abroad Historical Visitation – Outbound 1994-2004, » July 2005.

Catégories
Facts and figures Geographic markets Management

Statistics are not always what they seem

Everyone – those in the industry, government bodies, academics, journalists and more – uses statistics from the World Tourism Organization and Statistics Canada, thereby contributing to the dissemination of this data. However, a closer look at these statistics reveals that things are not always what they seem. Methodological considerations aside, here are a few examples of what these statistics do not tell us!

Canada may no longer be one of the WTO’s top ten international destinations, but… when it comes to the tourism statistics produced by the World Tourism Organization (WTO), the data collection methods differ from one country to the next.

When compiling tourism data, some countries only count tourists, others include both tourists and same-day visitors, while still others report one tourist more than once during a single visit, because the tourist is counted each time he or she stays in a different hotel (see the table below).

If all countries used the same data collection method, the WTO’s infamous international ranking would be much different and Canada’s position would rise. Currently ranked 11th, Canada compiles its statistics using the TF method (see table), in other words, by simply counting the number of international tourists who enter its borders. The United Kingdom and Hong Kong, ranked 6th and 7th respectively, include both tourists and same-day visitors in their numbers (VF method). If Canada used the same method (tourists and same-day visitors) as the United Kingdom (27.7 million) and Hong Kong (21.8 million), it could add the 17.8 million same-day visitors who entered by car in 2004 to its 19 million or so international arrivals and thereby surpass both in the ranking. Germany and Austria, which rank 9th and 10th, employ the TCE method to compile their data, which means that if a single tourist stays in four different hotels during his or her stay, he or she is counted four times.

Tourism receipts: local currencies vs. US dollars

The WTO reports international tourism receipts in US dollars and in local currencies at constant prices. When tourism receipts (in yen, pesos, Euros, etc.) are converted into US dollars, figures can be compared and analyzed and used to create an international ranking. However, expressing receipts in local currencies at constant prices neutralizes the effect of exchange rate changes and inflation. When the US dollar depreciates against a given currency, this situation can inflate tourism receipts converted into US dollars. For example, Spain’s tourism receipts climbed 14.1% from 2003 to 2004 when expressed in US dollars, while they rose only 3.8% when expressed in Euros (the local currency). The same thing was true for Australia. Its receipts jumped 25.5% in 2004 when they were converted into US dollars, but climbed only 10.7% when they were expressed in constant Australian dollars. In addition, international tourism receipts include revenues generated by both tourists and same-day visitors.

Tourist activities

Statistics Canada has developed a special tool for finding out how many people engage in a given activity when travelling, but the Canadian Travel Survey (CTS) and the International Travel Survey (ITS) have different ways of reporting the number of participants. For example, let’s say that three people took a trip together. During their stay, one of them went shopping while the other two played golf.

  • ITS – Regardless of which person in the group answers the survey, Statistics Canada will count 3 people as shoppers and 3 people as golfers.
  • CTS – If the person answering the survey is the one who went shopping, then Statistics Canada will count 3 people as shoppers and 0 as golfers.
  • CTS – If the person answering the survey is one of those who played golf, then Statistics Canada will count 3 people as golfers and 0 as shoppers.

A solo traveller is, by definition, a person travelling alone…or is it?

Statistics Canada has a very different definition of solo traveller. According to the CTS, a person is considered to be travelling alone if they are not accompanied by someone from the same household. Therefore, a person is reported as a solo traveller even if:

  • he or she is accompanied by a family member (mother, daughter, brother, etc.) who does not live under the same roof,
  • he or she is travelling with friends, or
  • he or she is on a group tour package.

For the ITS, the method is different. People are only considered to be travelling alone if they are unable to provide any information on the expenditures and activities of the people accompanying them or if they are part of a group. However, as of 2005, the CTS was replaced by the Travel Survey of Canadian Residents, which uses the ITS definition of a person travelling solo.

Statistics will never look quite the same

When the WTO publishes its Top Ten, the data is disseminated around the globe without a word about the differences in collection methods. Statisticians must obviously work with a number of limitations if they wish to make sense of the information they gather. However, a closer look at the methodology sheds new light on the mishmash of numbers known as statistics and the way in which they are interpreted!

Sources:
– World Tourism Organization. [http://www.world-tourism.org/facts/menu.html]
– Statistics Canada, Canadian Travel Survey
– Statistics Canada, International Travel Survey
– Statistics Canada, International Travel, Advance Information, December 2004, vol. 20, no. 12, released February 2005.