Catégories
Geographic markets

Overview of Canadian Outbound Travel

Frequent travellers, Canadians spend a lot when they travel and are open to emerging destinations. However, they also enjoy long-standing favourites, with the United States accounting for nearly three-quarters of their international trips. At the same time, they are strongly attracted to the sun and beach. The Caribbean, notably Cuba and the Dominican Republic, and Mexico have been welcoming growing numbers of Canadians for the past several years. European countries, predominantly France and the United Kingdom, remain favourite destinations. The image below illustrates some key figures.

canadian_outbound_travel_overview

Significant spending

According to a study published by the European Travel Commission, Canadian outbound travel grew by nearly 6% annually between 2004 and 2013. The World Tourism Organization ranks Canadian travellers 7th, in terms of international tourism expenditure: they spent CN$37 billion in 2013 (excluding the cost of international travel), or more than double what they spent 10 years ago.

In 2015, travellers from Ontario recorded the greatest number of trips abroad by far, accounting for 15 million, followed by those from British Columbia and Quebec. Compared to 2014, the number of trips to countries other than the United States increased by over 10% in each of these three markets.

number_of_canadian_trips_abroads_in_2015_figure_1

Favourite destination: the United States

Canadian travel to the United States grew by an average 7% annually for at least a decade, up until 2013. Since then, the number of trips to the United States has dropped, in part because of the changing exchange rate.

As the following figure illustrates, travel to other destinations has grown almost every year. In the last 15 years, the number of leisure trips taken by Canadians outside the country has jumped 92%.

number_of_canadian_trips_abroads_200_2015_figure_2

Sun destinations and Asia on the rise

The Caribbean and Mexico are very appealing to Canadians, attracting nearly 5 million Canadian visitors in 2015. The 4.7% increase in travel from 2014 to 2015 is almost entirely due to the growth of arrivals to Cuba, Mexico and the Dominican Republic. Together, these three destinations account for over three-quarters of the Canadian trips to this region. Figure 3 illustrates this growth since 2012.

number_of_canadian_trips_in-mexico_cuba_republic_dominica_figure_3

Countries in the Asia/Pacific region have also seen an appreciable increase in the number of Canadian visitors, welcoming 2.4 million in 2015. As Figure 4 shows, China, Hong Kong, Japan and Thailand are the most popular destinations.

More European destinations

According to the Conference Board of Canada (based on estimates from 24 countries), Europe received more than 4.7 million Canadian arrivals in 2015. For many years, France, the United Kingdom, Italy, Germany and Spain have accounted for two-thirds of Canadien trips to Europe. However, less traditional European destinations like Greece, Finland and Croatia have been making significant inroads into the Canadian market. Primarily chosen as a summer vacation destination, Europe welcomed 6.2% more Canadian visitors in the winter of 2015-2016, compared to the previous winter.

canadian_arrivals_destinations_2014_2015_figure_4

Independent travellers

Canadians are primarily independent travellers (FIT), opting for personalized itineraries rather than organized programs. For Canadian travellers, the purpose of stay in Europe is not the same as that for other destinations. While 14% of trips to the United States are taken to visit friends and relatives, this proportion rises to 38% in the case of travel to Europe. In addition, the percentage of Canadians travelling for business is higher in Europe than elsewhere.

canadian_travel_purpose_stay_figure_5

Drivers of growth

Several elements will drive the growth of Canadian outbound travel in the coming years:

  • Although it is modest, Canada is in a period of economic growth.
  • Baby-boomers , which represent a significant portion of the population (29%), are gradually retiring. These individuals have a lot of discretionary income and want to travel.
  • The demand for travel to visit friends and relatives is high among Canadian residents from various ethnic communities who travel to their country of origin.
  • Canadians are familiar with digital marketing and are among the most active populations on social media. Destinations are using effective measures in the field of digital technology to increase their promotional efforts, which should stimulate Canadian outbound travel.

Image on first page: ©StockSnap

Catégories
Accommodation etourism and technology

Online Behaviour of Airbnb Travellers

The private accommodation rental market has not escaped the tidal wave of online information that brings us to today’s diversified offer on a number of specialized sites. The PhoCusWright study states that, in the United States, the penetration rate of these online reservations has gone from 12% in 2008 to 24% in 2012. The arrival of start-ups in the collaborative economy, such as Airbnb, and the improvement of already well-established sites in this market, such as HomeAway, have helped accelerate this trend.

This trend gave rise to a new generation of renters, or “New Gen Renters,” whose travel behaviour differs from that of travellers who use other types of accommodation. This distinction was made following an analysis of these travellers, that was based on a PhoCusWright study of their online planning and booking habits. The results of that study are described below.

AL_Airbnb_2_encadre_anglais

New Gen Renters very active online

When planning their leisure trips, New Gen Renters are more likely to search the Web on a mobile device (32%) or a tablet (29%) than other renters (see Graph No. 1). They also more frequently use other sources of information, such as recommendations from relatives and friends, online advertising and promotional emails. The behaviour of other renters more closely resembles that of other travellers who do not rent private accommodation.

AL_Airbnb_2_graph_1_anglais

New Gen Renters browse more sites to compare and choose the various components of their trip

All three categories of traveller primarily access the same sources for their online trip planning (see Graph No. 2). Online travel agencies such as Expedia or Priceline came first, followed by search engines and comment sites such as TripAdvisor. However, New Gen Renters browse more sites to compare and choose the various components of their trip. Almost 40% of these new renters use social media, compared to 11% of other renters and 12% of non-renters. This gap also holds true for travel guide sites and online magazines, news websites and private accommodation rental websites – although the latter category is also accessed by a significant proportion (20%) of other renters.

AL_Airbnb_2_graph_2_anglais

What online content are they looking for?

New Gen Renters have a strong appetite for online travel content (se       e Graph No. 3). They access comments and opinions, professional and amateur photos and videos, and supplier posts to plan at least half of their stays. They are far more likely than other renters and non-renters to view this information on social media.

AL_Airbnb_2_graph_3_anglais

Inspiration and personalization

The inspirational aspect of the site is very important for this new generation. Indeed, 41% of them look for new trip ideas online, whereas this objective is only shared by 28% of other renters and 29% of non-renters. This group is also looking for a more personalized web browsing experience than the other traveller groups, with 27% preferring a site that saves their personal information in order to recognize them on subsequent visits, compared with 12% of other renters and 9% of non-renters.

New Gen Renters are spontaneous

The “other renters” category books its stays further in advance than other segments: 57% do so at least one month before departure, whereas only 41% of New Gen Renters and half of non-renters adopt similar behaviour (see Graph No. 4). In fact, there are proportionally more last-minute New Gen travellers, as 43% of them book less than three weeks before their trip is due to start, compared to 33% of other renters and 31% of non-renters.

AL_Airbnb_2_graph_4_anglais

Keen collaborative consumers

According to PhoCusWright, New Gen Renters tend to use collaborative sites such as Airbnb to book their accommodation. This segment is also attracted by a similar approach to getting around: 21% of these avid users of new technology used a car-sharing app during their stay, compared to a fairly low percentage (6%) of other renters, and only 2% of non-renters. They are also more likely (25% compared to 11% and 6%, respectively) to have used app-based rideshare services such as Uber and Sidecar.

Should the traditional hotel market be concerned?

According to PhoCusWright’s probability calculations based on the frequency of travellers’ leisure trips, it seems that each time a traveller rents private accommodation, the chances he or she will book a hotel room within the same year drop by 24%. Similarly, if a traveller stays in two rentals over the course of the year, the chances he or she will stay in a hotel drop by 50%. In other words, the more often travellers stay in private accommodation, the less likely they are to book a hotel room. While this statement may alarm hotel owners, they should remember that, in 2013, only 14% of U.S. travellers rented a private house or apartment, and only 3% booked a room or a bed in a private home. In fact, it was the least popular type of accommodation.

Fundamental shift or passing trend?

Will the advocates of collaborative consumption – largely members of Generation Y – continue to travel this way as they grow older? It is difficult to predict the future, but one thing is certain: their use of the Internet and an array of technological tools is permanently rooted in their travel behaviour. Accommodation providers therefore have no choice but to react – and adapt to! – this enduring trend!


Image à la une: © istockphoto

Catégories
Accommodation etourism and technology

Who are these travellers booking on Airbnb?

Renting short-term lodging has become an increasingly common accommodation choice for travellers, made popular by the advent of websites such as Airbnb. A survey conducted in the U.S. by PhoCusWright profiles these users and defines their behaviour as it compares to that of other traveller groups.

Methodology

The web survey was conducted in February and March 2014 among 1,880 American respondents who had made at least one leisure trip during the previous 12 months. To be eligible for the survey, they had to have reserved commercial accommodation and planned the trip themselves. The company identified two categories of traveller: those who rented private accommodation (room, house or apartment), i.e., the renters (17%), and those who booked other types of accommodation for their stay (non-renters; 83%).

Young travellers with a good income

A number of factors separate the renters from the non-renters: over half (51%) of U.S. travellers who rented private accommodation during the previous year were under 35, compared to 38% of travellers who booked another type of accommodation (see Graph 1).

AL_Airbnb_1_anglais_graph_1

There was also a definite difference in earnings between the two traveller groups: 33% of non-renters had an annual household income of less than US$50,000, compared to 24% of renters. Also, the proportion of the latter group with incomes between $50,000 and $125,000 is higher than it is among non-renters, indicating that, generally speaking, renters are more prosperous than other traveller group.

Renters travel for longer and are more active

Almost two out of three renters (63%) travelled for one or two weeks during the previous year, while only 43% of non-renters were away for the same period of time. Furthermore, the first group made more trips abroad (42%, compared to 31%).

Aside from flights, renters are proportionally more likely than the other group to book several components of their trip (car rental, package, cruise, train, visit). This fact makes them more active travellers, who tend to do more (see Graph 2).

AL_Airbnb_1_anglais_graph_2The “New Generation of Renters” – a distinct category

Among the travellers who rented a private room, house or apartment during the past year, PhoCusWright has defined a new category of traveller that it calls “New Gen Renters.” Between 18 and 34, these travellers represent 31% of all renters and see themselves as avid users of new technology.

This group spends more on vacations and travels more frequently. In fact, a typical household in this category allocates an average of US$4,338 per year to travel, compared to US$3,743 for the other renters and US$3,153 for non-renters. Furthermore, 27% of these travellers have made at least six trips during the previous year, compared to 15% of the other renters and 9% of non-renters.

New Gen travel behaviour

Several aspects of New Gen travel behaviour distinguish this group from other travellers, such as:

  • They want to explore the destination as much as possible: meet new people and share their experiences with them;
  • They are spontaneous, travelling as soon as they have the means to do so;
  • When staying in commercial accommodation, they seek out stylish, smaller hotels;
  • They like to travel alone or with friends.

Preferred types of accommodation

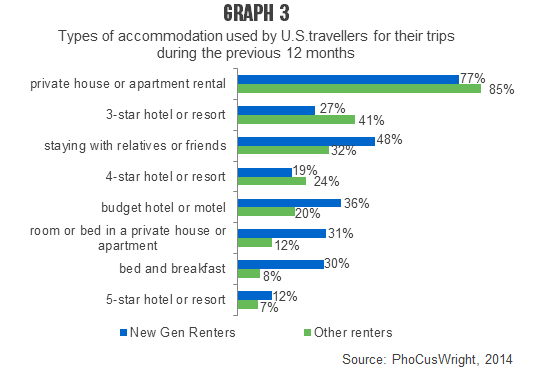
New Gen Renters tend to spend less on accommodation than other renters, since they are more likely to stay in budget hotels, bed and breakfasts or rooms, or else rent a bed in a private home (see Graph 3).

Note that PhoCusWright distinguishes between two types of rental accommodation: the one where the customer rents the entire residence from which the owner is usually absent (see “private house or apartment rental,” below); and the one where the renter only has access to part of the residence, and where the owner is usually present during the rental period (see “room or bed in a private house or apartment,” below). The latter type can be found on websites such as Airbnb, but is completely absent from websites such as HomeAway, that specialize in the first type of rental accommodation.

AL_Airbnb_1_anglais_graph_3

Why choose a rental over hotel accommodation?

The three main deciding factors for all renters are that they can find similar facilities and equipment to those at home, that they have more space, and that the rental can accommodate more people (see Graph 4). However, New Gen Renters particularly like the fact that rentals provide more freedom and privacy than a hotel room, that they offer a more relaxed ambiance, and that they are generally less expensive.

AL_Airbnb_1_anglais_graph_4

How will hotel owners react?

Should hotel owners be alarmed at the prospect of losing part of their clientele to private accommodation? According to PhoCusWright, 82% of non-renters did not even consider the rental option for their trips during the previous 12 months. However, hotel operators would do well to adapt to these New Gen Renters because, although rentals may better meet their needs, they nevertheless use different types of accommodation when travelling.

A second analysis examines the online planning and booking habits of this New Generation, and looks at possible ways of resolving the concerns of the hotel industry.


Image à la une: © BY NC Melies The Bunny

Catégories
Facts and figures Products and activities

The rising popularity of snowshoeing

Methodology

The Transat Chair in Tourism, Sépaq and several regional and sector-based tourism associations recently conducted a survey on the recreational habits and travel behaviours of cross-country skiers and snowshoers. The following data were taken from a sample of 373 respondents who had used Quebec snowshoeing trails over the course of winter 2011-2012. Of these respondents, 95% lived in the province. In some cases, it is interesting to compare the snowshoer’s profile with that of the cross-country skier.

Enjoying the great outdoors as a couple or with friends

The pastime of snowshoeing primarily attracts individuals aged 45 to 54 (Figure 1), but it is also popular among young women aged 25 to 34 (26%).

ND_Snowshoeing_figure1

Although a quarter of respondents have been snowshoeing for two years or less, nearly a third have engaged in the sport for at least ten years (Figure 2)[ES-C1] . Most participants usually go out three to nine times per year (53%), but nearly one-third (32%) slip on their snowshoes more than 10 or even up to 20 times each winter.

ND_Snowshoeing_figure2

More than half of respondents usually go snowshoeing with their spouse (this is especially true of those aged 45 and up) and 50% go with friends (Figure 3)[ES-C2] . Among young people aged 25 to 34, 63% snowshoe primarily with friends.

ND_Snowshoeing_figure3

The quality of the scenery and the chance to be outside are major draws for these slow moving hikers (Figure 4). Many of them also appreciate the opportunity to explore new regions (50% compared to 37% for cross-country skiers), and the chance to interact with friends and family (47% compared to 35% for cross-country skiers).

ND_Snowshoeing_figure_4

Winter walking, ice skating, cross-country skiing and downhill skiing are other winter activities enjoyed by snowshoers. However, one quarter of enthusiasts prefer to devote themselves solely to snowshoeing (Figure 5).

ND_Snowshoeing_figure5

Snowshoers and their most recent excursion

The Quebec City region attracted a high percentage of all snowshoers (29% of respondents had taken its trails), followed by the Eastern Townships (20%) and the Laurentians (18%) (Figure 6).

ND_Snowshoeing_figure6

On their most recent excursion, more than one snowshoer out of four (26%) visited the region for the first time, indicating that participants tend towards repeat visits.

When asked about their most recent snowshoeing excursion, more than half of respondents (56%) stated they were already familiar with the destination. Furthermore, 38% either sought advice from friends and family or consulted the Internet, in equal numbers. They began their research by seeking information about the trails and services offered by the various national parks (62%), then turned to general search engines (Figure 7).

ND_Snowshoeing_figure7

Among snowshoers who surfed the Web, the majority looked for practical information (trail maps, location, services) before seeking out area activities and attractions (Figure 8). Unlike cross-country skiers, snowshoers were more influenced by promotional offers (41%) and the variety of on-site experiences.

ND_Snowshoeing_figure8

Nearly one out of two respondents (47%) chose a destination close to home, travelling only a short distance (less than 40 km) to reach it. However, more than one out of four travelled over 100 km (Figure 9). With an average travel distance of some 73 km to their starting point, snowshoers appear somewhat mobile.

ND_Snowshoeing_figure9

During their most recent excursion, most respondents snowshoed for three hours or less, but 43% did go out for more than three and, in some cases, up to five hours (Figure 10). Like hikers, snowshoers like to take their time and linger on-site, which is conducive to observing nature and sharing experiences with friends and family.

ND_Snowshoeing_figure10

Furthermore, while many respondents opted to snowshoe with just one other person (43%), group outings were also popular. One snowshoer out of three was accompanied by two to four people (34%), while one in seven was in a group of more than five individuals (14%).

How can destinations attract these visitors?

Snowshoers demonstrated an obvious interest in the following criteria:

  1. An extensive network of available trails: above all, they are seeking a variety of terrains.
  2. Destination discounts or on-site packages: for example, incentives could include post-snowshoeing activities, entrance fees, restaurants or leisure activities in the area. Snowshoers seem to be looking for a comprehensive product.
  3. The existence of attractive packages offering access to more than one snowshoeing site: willing to travel to explore other regions, snowshoers seek more flexible packages.
  4. A place to change one’s clothes, grab a bite, relax or simply organize one’s excursion in adapted facilities protected from the elements.
  5. A variety of accommodations and food services: inns, hotels, B&Bs and other lodgings would be well-advised to take advantage of this and enhance their visibility so as to attract this accessible and impressionable clientele.
  6. Interpretation tools available on the trails: such tools are an effective way to retain the clientele and enhance its site experience.

The search for multiple activities

More than two snowshoers out of five (42%) would be willing to engage in additional activities and about the same percentage (40%) would be likely to prolong their visit if they could dine on-site. Also, evening events seem to attract snowshoers (36%) even more than cross-country skiers (27%), as do guided tours (23% compared to 17%).

A growing pastime with a diverse clientele, snowshoeing presents an opportunity for businesses who would like to improve, diversify and complement their existing products. Are you ready to welcome snowshoers this winter?

Catégories
Distribution networks Sustainable tourism

Canadian Travel Agents and Carbon Offsets

In 2006, 26,400 metric tonnes of carbon dioxide were emitted into the atmosphere, of which tourism contributed 5% (UNWTO, 2008). Of that 5%, air travel was responsible for 40% and land travel for 36%.

The relationship between climate change and tourism is interwoven and interdependent.  Climate change has major implications for the future of tourism because weather conditions factor heavily into the business direction of tourism operators. In Canada, seasonal and outdoor tourism may be adversely impacted by abnormal or unpredictable weather patterns, and costly changes to infrastructure may be required to cope with these changes .

With the growing concern about the effects of climate change and how the tourism industry is vulnerable to these effects, the challenge is to determine the awareness of tourism stakeholders and their level of participation in mitigating such effects.

A 2008 study by L. Kole et al at Ryerson University aimed to determine the level of awareness among Canadian travel agents with regard to climate change, and their willingness to offer carbon offsetting as a mitigation strategy to their clients. The study also aimed to determine whether more information regarding environmental issues and carbon offsetting needs to be provided to travel agents to assist them in channelling this knowledge to consumers.

The study sent an e-survey to 1886 members of the Association of Canadian Travel Agents (ACTA) and 2,500 members of the Canadian Institute of Travel Counsellors (CITC). The study received a 5.9% response rate.

Findings

The study found that while travel agents consider climate change a threat, they were unaware of the tourism industry’s contribution to climate change. Their consumers, travellers, also did not make the connection between climate change and their travel habits. Most travel agents have a ‘basic’ understanding (50%) of climate change and carbon offsetting. More than 50% said their first business priority was ‘making a profit.’ However, 9% of travel agencies said their first priority was ‘spreading knowledge of climate change.’ In addition, although 46% of agents felt it was important to communicate environmental issues related to tourism, they were not encouraged to do so by their agencies.

Some 34% of Canadian travel agents believe their customers would be willing to pay up to $10 as an additional charge for carbon offsets, although they felt that the government should bear the financial costs of carbon offsets. Less than half of these agents ’sometimes’ suggest carbon offsets to their customers while customers ‘rarely’ bring up the option of carbon offsets.

The study concludes that since most travel agents have only a ‘basic’ knowledge and understanding of climate change, they are not sufficiently informed to help transfer knowledge about climate change and carbon offsets to their clients. This is also the main reason that agencies are apprehensive about presenting carbon offsetting as a viable option. Travel agents need to be well-versed in environmental issues and carbon offsetting in order to be ambassadors of environmental change.

Implications

In order to increase awareness, a combined effort needs to be initiated among governments, academic institutions and corporations to educate agents about the effects of climate change on tourism and carbon offsetting. As travel agents are representatives at the frontline of the tourism industry, they wield considerable influence when it comes to travellers’ actions and awareness of environmental issues.

There are a number of approaches for communicating climate change awareness within the tourism industry and for making climate change and carbon offsetting a fundamental part of the industry:

  1. Education Campaign for Agents – climate change and mitigation strategies should be part of travel training institutions’ curriculum.
  2. Increase client awareness through the tourism industry, in order to incorporate this issue into mainstream culture.
  3. Offer clients a flat-rate fee for carbon offsetting.

Travel agents must realize that they can help mitigate the effects of climate change. Agents can inspire action by educating consumers about how their travels contribute to climate change, and by offering them carbon offsetting options to enable them to reduce their carbon emissions.

Sources:

Kole, L., Krestell, S., Parlagreco, L. & Dodds, R. (2008). Climate Change and Carbon Offsetting. Toronto: Ryerson University. 49 pages.

United Nations World Tourism Organization (2008). Climate Change and Tourism:
Responding to Global Challenges. Retrieved from http://www.unwto.org/index.php

Catégories
Sustainable tourism

Younger, Less Affluent Travellers Willing to Pay More for Sustainable Tourism

Although there has been a continuous increase in global tourism despite the economic recession (902 million international travelers in 2008 – a 4% increase over 2007), negative effects are also being identified by businesses and governments alike. One of the ways to counter detrimental effects is for tourists and locals to engage in sustainable tourism practices. The demand for sustainable tourism is difficult to assess, however, as most figures are anecdotal and reflect a willingness to participate rather than pay.

Although multiple studies have been conducted by organizations such as Lonely Planet, National Geographic and others, there is little research data about visitors to Canada, let alone Canada’s biggest city – Toronto. A 2007 study conducted by Arente and Ennamorato on Canadian tourists’ awareness and perceptions of sustainable tourism found that only 12% of Canadians are ‘somewhat’ familiar with the concept of sustainable tourism while 31% had never even heard of it. As for participation in sustainable tourism practices, 49% would choose to participate in activities that have sustainable benefits while travelling and 42% would use travel agencies that follow sustainable tourism guidelines. Over 75% of respondents believe that businesses that market and sell tourism as well as mass media should take on the responsibility of distributing information on sustainable tourism.

To augment this data, a recent study of 400 visitors to Toronto was conducted by Dodds, Antonov, Babkina & Gordon (2008). The purpose of the study was to determine the level of demand for and use of sustainable tourism products (e.g., choosing responsible tour operators, carbon offsetting flights and car rentals, purchasing green products and services such as hotels who showcased environmental policies,  and organic and fair trade food/products).

Findings

The study found that young and not necessarily affluent respondents were willing to pay for sustainable products. Of the respondents, 46% were between the ages of 19- 29 and had a relatively low household income (48% with an income of $24-59,000). Results showed that 11% were willing to pay 11-25% more and 59% of respondents were willing to pay 1-10% more.

Although there is often confusion over the term ‘sustainable tourism’ (45% had never heard of sustainable tourism or were not familiar with it as a form of tourism), 72% of respondents said they were likely to use sustainable tourism products in the future.

The study also found that the more respondents were likely to consider buying sustainable tourism products in the future (77%), the more likely they would pay a premium for them.

In terms of motivation or choice, 44% of respondents said they participated in sustainable tourism practices because they did not want to harm the environment. Although this number is not the majority, many people were also concerned that it corresponded with their moral values (38%) and understood the importance of doing so (39%).

Conclusions

Many sceptics maintain that there is not outstanding participation in or widespread demand for more responsible tourism products. This, however, may be due to limited awareness (33% of the travellers who had never purchased sustainable tourism products said that this was because they were not aware of them).

Canadian travellers are also comparable to international travellers. In a 2007 TripAdvisor ecotourism survey of 1,000 travelers worldwide, 38% responded that environmentally-friendly tourism is a consideration when travelling. This finding is similar to the Toronto study. Only 4% of respondents were ‘not at all’ likely to participate in sustainable tourism practices while travelling in the future, while 44% were ‘somewhat’ likely to consider purchasing sustainable tourism products.

References :

Arente, H. & Ennamorato, M. (2007). Sustainable Tourism: Travel Like You Mean It!  Toronto: TNS Canadian Facts. Retrieved Dec 16, 2008, from http://www.tns-cf.com/conferences/ttra/ttra-2007.pdf

Dodds, R., Antonov, Y., Babkina, I., & Gordon, S. (2008). Travellers’ Demand For and Participation in Sustainable Tourism Practices in Canada. Toronto: Ryerson University.

TripAdvisor. (2007). TripAdvisor Travelers Keen on Going Green. Press release. Retrieved Dec 16, 2008, from http://www.tripadvisor.co.uk/PressCenter-i120-c1-Press_Releases.html

Catégories
Accommodation Sustainable tourism

Tendency of adherence to green labels in hotels across Canada

Improvements of environmental performance by the accommodation sector are not measured systematically and this makes it hard to estimate the extent of real change. In Canada it is certainly not uniform according to adherence to the programs detailed in Table 1. Although some hotels continue greening their performance, the sector is only at the beginning of reducing its ecological footprint. For example, if we compare the results of Table 1 to the number officially registered accommodation establishments in Quebec by the Corporation de l’industrie touristique du Québec, less than 2 % of the sector participates in any of these programs.

analyse_green_certification_JP

Green-Keys Eco-Rating Program

analyse_green_certification1_JPThe Green Key Eco-Rating Program was launched in 1997 and it is administered by the Hotel Association of Canada (HAC). The number of green keys recognizes participating establishments and more keys mean more « green » measures implemented. Although any establishment can apply for the label, the program is still designed for large hotels. Participation is comprised of a self-administered on-line audit that consists of 140 questions across 5 categories of operation. Since 2007 the HAC performs random on-site audits.

At present about 600 properties are registered with the program across Canada (Table 1). The aim is to reach 1000 by the end of 2008, which would represent 30 to 40 % of all hotels in Canada with 50 rooms or more. In March 2008 Ontario and British Columbia had the most hotels participating in the program (Table 1) and most were part of a chain and had a 3 key rating . Hotels with a five key rating are considered to have the highest standards in environmental management and social responsibility throughout all areas of operations set at an international standard for sustainable hotel operations (refer to list at the end for examples).

In Quebec labeled establishments are unevenly distributed on the basis of official tourist regions. Montreal has the highest number of establishments followed by Quebec and Montéregie, but some regions have no participants at all. 

Eco-rating programacross different tourism regions of Quebec.

Greenleaf Audubon

analyse_green_certification2_JPAudubon International’s eco-rating program is offered jointly with TerraChoice Environmental Marketing, Inc. and exists since 2000. Participating establishments are recognized by the number of green leaves (1 to 5) and more leaves imply more environmental measures implemented. Participants conduct a self-evaluation covering six key areas of operation that are analyzed by TerraChoice Environmental Services, who also direct the independent verification process and conduct random on-site spot checks of establishments.

Although any type of accommodation facility can join the program, in March 2008 only 44 were members in Canada and mainly in Manitoba, Nova Scotia and Ontario (Table 1). Most Canadian participating establishments had 3 leaves. The only two establishments in Quebec were in Montreal and each had two leaves. The low number of participants in a Canadian context is due to the popularity of the HAC’s green-key program although some hotels participate in both.

Réser-vert

analyse_green_certification3_JPIn November 2007, l’Association des hôteliers du Québec with its private and public sector partners announced its own program to recognize establishments who have implemented sustainable development principles. Participating establishments receive the logo of Thuya occidentalis, whose different colors represent the 3 pillars of sustainable development. Similar to the other programs, this one also involves an initial self-assessment of 140 specific operations in 10 categories. Any, accommodation establishment is eligible to apply. Given the program’s recent creation, statistics are not yet available to show participation rate.


LEED

analyse_green_certification4_JPThe most rigorous program for the built environment is LEED, administered by the Canadian Green Building Council. It is applicable to newly constructed and establishments in renovation and participants conduct an assessment of performance measures. Once registered, participants conduct an evaluation across various operational categories to obtain silver, gold and platinum certificates. In March 2008 there were six hotels registered in Canada, half of which were in Ontario (Table 1) and the highest-level of certification was gold.

Does the market care?

There is proof (at least suggested by large hotel chains) that being green means a good image, savings and net improvements of economic performance. As the market is starting to adjust to the « green revolution », being green will continue being important. Most studies also suggest a rising demand for green accommodation although how this translates in real figures in different destinations is not yet ascertained. However, it appears that the eco-coconscious traveler is no longer satisfied by symbolic environmental efforts such as opting to reuse towels.

European reports indicate that corporate social responsibility will become an even more important factor for the meetings and events sector over the next years and this trend appears to be the same in North America. Based on the 2008 Hotel Association of Canada / Fleishman Hillard Travel International Travel Intention Survey, greenlodgingnews.com reported that 29 % of business travelers compared to 21% of leisure travelers were prepared to pay 5 % more for a more eco-friendly stay. The same study also showed that 52 % of all travelers surveyed sought hotels with strong green practices « occasionally » or « as much as possible » compared to 46 % who said « rarely or never ». Interestingly 91 % of all respondents were not familiar with Canada’s Green Key Eco-Rating program. When asked if their organization had a green travel policy 60 % said no, 8 % said yes and 32 % did not know.

In the meantime the hotel industry needs to do what makes business sense. An establishment that is weak on both values and commercial competence will mean bad business in the future. The snapshot of adherence to green certification programs suggests that small hotels are laggards in environmental responsibility given that most of the hotels labeled today belong to chains, even if in reality many small establishments are actually improving their sustainability performance. The challenge to translate environmentalism into profits may be much higher for them. Given that tourists are not yet green enough means time is in their favor. There might be other forces at play that will push them in the « green » direction such as the prediction that energy prices could be 70 % higher in some Canadian provinces and landfills fees over the next five years.

All hotels must change their practices to move towards sustainable operations and there are literally hundreds of resources to help with the process today, including many examples of good practice.

Best practice hotels according to labels mentioned in this analysis:

Siwash Lake Ranch

The Fairmont Chateau Lake Louise

Hospitality Inns & Suites, Lloydminster

Monterey Inn Resort & Conference Centre

Trout Point Lodge

Aurum Lodge

E’Terra Inn

Endnotes:

Participation costs in programs is variable. For members to an organization, the costs are as follows to the aforementioned programs:

Green Keys of Hotel Association of Canada: CAD 350 (+ GST) annually per property.

Audobon’s Green Leaf: CAD 500 (+ GST) plus $ 1/room, for establishments with less than 50 rooms and CAD 800 (+ GST) plus $ 1/room for establishments for those with more than 50 rooms.

Reser-vert: Hotel Association of Quebec: For members it CAD 150 to enter the program and subsequently the program costs CAD 350 (+GST) annually.

Leedership in Energy and Environmental Design: The cost of participation is dependent on the size of establishment. For a hotel with less than 500 m2 surface area in Quebec certification would be around CAD 4200 (+ tax) plus registration cost CAD 1000 + GST). For establishments that are in renovation the fee is about 50 % less, including registration fee.

Sources:

– Audubon Green Leaf Eco-rating Program: [http://www.terrachoice.ca/hotelwebsite/indexcanada.htm], last accessed March 30 2008.

– Buckley, R. (2002) Tourism Ecolabels. Annals of Tourism Research, 29(1) p.183-208.

– Canadian Green Building Council: [http://www.cagbc.org], last accessed March 30 2008.

– Corporation de l’industrie touristique du Québec (CITQ) (2008): [http://www.citq.info/nouvelles/statistiques.asp] last accessed March 30 2008.

– Font, X. and Harris, C. (2004) Rethinking Standards from Green to Sustainable. Annals of Tourism Research, 31(4) p.986-1007.

– Hasek, G. (2008 a) Leed Gold-Certified E’Terra Inn is Natural Fit for Niagara Reserve. Green Lodging News, 02-06-2008. [www.traveldailynews.com], last accessed March 30 2008.

– Hasek, G. (2008 b) Canada’s Hoteliers Gather to Explore Green Trends, Best Practices. Green Lodging News, 02-26-2008. [www.traveldailynews.com], last accessed March 30 2008.

– Hospitality and Sales Association International Summer 2007 edition. Resources for Resourceful Hospitality Firms. p. 28-30.

– Hotel Association of Canada: [http://www.hacgreenhotels.com/index.htm], last accessed March 30 2008.

– Hotel Association of Quebec: [http://www.hoteliers-quebec.org/fr/accueil.php], last accessed March 30 2008.

– McDonald-Gibson, C. (2008) Des hotels écolos tendent la main aux voyageurs. Agence France-Presse, le jeudi 3 avril 2008.

– Reiser, A. and Simmons, D. G. (2005) A Quasi-experimental Method for Testing the Effectiveness of Ecolabel Promotion. Journal of Sustainable Tourism, 13(6) p.590-616.

– Terra Choice Environmental Marketing (2008): [http://www.terrachoice.com], last accessed March 30 2008.

– Verikios, M. (2007) CSR Higher on the business agenda. Travel Daily News, 19-10-2007. [www.traveldailynews.com], last accessed 19 October, 2007.

– Verikios, M. (2008) Focus on environmental responsibility within meetings industry. Travel Daily News, 09-04-2008. [www.traveldailynews.com], last accessed April 10, 2008.

Catégories
Accommodation Management

Building a customer database

To begin with, customers are the very heart of your organization; they keep your company alive. Without your customers, you would not be in business.

LL Bean, an outdoor equipment and apparel company in the United States, displays this saying on its office walls: “A customer is not dependent on us, we are dependent on him.”

At Disneyland Resort Paris, there are no “customers,” but “guests.” In the service industry, especially the travel and leisure sector, the customer is indeed a guest.

This is why I would like to add a fifth P (People) to the 4Ps of the marketing mix (Product, Price, Place and Promotion), to cover customers and customer relationship management.

Knowing your customers is one key to successfully boosting sales because it enables you to:

  • Suggest the right product or holiday package
  • To the right customer
  • At the right time

Quite often, the 20/80 rule is very accurate when analyzing a company’s clientele: 20% of the customers account for 80% of the business volume. Therefore, creating a customer database and becoming familiar with its features can definitely help improve sales and consequently your company’s profitability.

The database should enable you to extract customers or prospects so you can:

  • Boost sales and profits
  • ncrease the number of new customers, thanks to word-of-mouth from satisfied customers
  • Encourage customer loyalty with new products and special offers
  • Get your message to your customers at the right time, for example, when they are planning their next vacation or weekend getaway with friends

Find the appropriate information

One has to begin by opening drawers and looking at your business’ customer records. Files should be consulted chronologically, in the following order:

  1. Marketing – Information Requests
  2. Reservations
  3. Reception – Front Desk
  4. Leisure and Recreation – Classes
  5. Dining: Meal Plan or Theme Supper
  6. Customer Accounts
  7. Customer Satisfaction Survey
  8. Commercial Services – TO/Agencies & Groups/Seminars

Some of your company’s divisions deal directly with customers and have a lot of useful information (like the contact information obtained when the customer last booked a stay or requested information).

Is your site a family holiday destination? Information about your customers (adults, parents, children and grandchildren) can be useful when you are creating new products or packages, like spring holidays aimed at seniors or family getaways on long spring weekends.

Some campground operators specifically target families with children ages 12 and under, while others seek teens and young adults. If you know your customers well, you can target potential customers that resemble them.

It is estimated that your customer base erodes at an average annual rate of 10%. Therefore, your file of new contacts and prospects must be replenished regularly. Since your current customers are the best ambassadors of your product, you should seize the opportunity to ask them for their friends’ and relatives’ contact information.

Organize the customer database

The data gathered must be organized and recorded to suit its ultimate use. Some words of advice: keep it simple and functional.

Too much information becomes useless information. Not every piece of information is useful or workable, in any event, not at first. It is better to start out simply and then develop your database as your needs grow.

Set realistic goals when launching your customer database and share these goals with your associates. They will no doubt have comments and suggestions on how best to collect and use the information gathered.

Monitor two indicators

In addition to qualitative data like the customer’s name, contact information and, of course, email address, it is useful to monitor two other types of customer information:

  • consumption history
  • communication history
  1. The consumption history includes information like:
  • dates of stay
  • duration of stay
  • number of adults and children (and their ages)
  • any reservations for rented accommodations – cabin, RV, bungalow, trailer
  • special features of campsite location – near a lake, in the woods, a specific site
  • several accommodations reserved with friends or relatives
  • optional activities: classes or reserved activities like horseback riding, tennis, canoeing, kids’ club, etc.
  • reserved dining options, such as a theme dinner
  • specific services like a baby monitor
  • outside products or services like a sound and light show being presented in the area

Of course, a consumption history will incorporate all information from prior years.

Experience shows that customers tend to spend the same amount of money at their vacation destination as they do on the rental. By monitoring your customers’ consumption during their stay, you can quantify the economic importance of each reservation and define profiles for targeting the most promising potential customers.

If you have more than one site, it would be useful to consolidate them when renewing contracts with third parties and travel professionals.

    2. The communication history records the dates and messages sent to each customer. You can monitor and measure the effectiveness of your communications and promotional offers.

As always in a communication campaign, it is recommended that you test your promotion on a representative sampling of your target clientele. A well-organized customer database will make it easier to quantify and evaluate your communication activities. The communication history is necessary for building customer loyalty. It enables you to develop a lasting relationship with your customers by taking their preferences and shopping habits into account.

Remember, wooing back an old customer is one-fifth the price of finding a new one.

By combining these two approaches (consumption and communication histories), you can, with a little experience, extract information and group together the profiles of similar or closely matched customers.

  • Once you define qualification criteria, you can use them to segment your database. Criteria like postal code, holiday period, family make-up, activities and purchasing method, either direct or indirect, will help you extract customers with similar characteristics.

For example, to tell your customers about a spring weekend promotion, you would extract all the addresses located less than three hours away by car. A four-day June package to explore the Loire Valley and learn about wine-tasting would be sent to customers who are able to travel at that time of year, like seniors.

Knowing your clientele is also necessary for properly positioning your product. In an increasingly competitive economy, it is vital that your market position and marketing goals be clearly stated.

The tools needed

There are many customer database management software programs available on the market. Select a customized tool that will enable you to format the customer database in accordance with your goals and uses. The ideal tool is one that you can develop as your needs progress and that functions with your office software programs (e.g. Excel, Word, Access).

Finally, you should be able to connect your customer database directly to your Website and operate it from the site.

With the Internet, you can communicate with each and every customer. Nowadays, it is indispensable to have a direct marketing tool for communicating and selling, because over 50% of all people search the Internet for information on their destination and holiday spot and 40% have used it to reserve travel products.

Should you operate more than one tourism business, building a customer database on your extranet site will make it even more efficient and functional. Some information can be centralized on it, or made available and useable for each department in your company.

Of course, access must be secure and adapted to each user’s responsibility level. The marketing department does not need the same data as the front desk or the person in charge of supplemental activities.

Customer databases are the property of a business and an important factor in its future success. Therefore, a responsible individual must be appointed to manage and coordinate the project with the input of the departments involved.

Use the database

Offering all customers the same benefits or discounts will only lower your profitability without guaranteeing an increase in sales. Often, this tactic simply leads to ongoing price-cutting. The only rule: any promotion or discount offered to a customer must always be justified and reflect the history of the customer’s relationship.

Analyze the reservations made and study your customers’ profiles to better understand their buying habits and then use this enhanced customer knowledge as part of your marketing efforts. You could improve business during slow periods or increase average revenue per customer.

You could launch a loyalty program that uses preferential treatment and specific extras to develop privileged customer relationships. Preferred customers will agree to receive communications from your company and send you valuable information about their preferences and future needs.

It is essential to involve your associates and increase their awareness. Without their daily input, your database will quickly become unworkable due to its incorrect, incomplete or simply out-of-date information.

A good database must be selective, exhaustive, nominative, up-to-date and accurate.

Catégories
Facts and figures Geographic markets Issues

Dollar (dis)parity is only part of the problem

Now the Canadian dollar has reached parity with its US counterpart, many questions are being raised. Without doubt, Canada’s performance in the American tourist market has been disappointing in recent years and the inexorable rise of the Canadian dollar in 2007 has only increased the level of anxiety in our industry. However, is our tourism deficit closely tied to the vagaries of the exchange rate? Is it a given that the flying loonie will aggravate our poor performance? By examining the issue from a broader perspective, we find that the reality is much more complex. We shouldn’t be too quick to blame all our tourism woes on the dollar exchange rate.

Concerns for the US market

The rise of the Canadian dollar in relation to that of Uncle Sam has been truly spectacular over the past five years. In 2002, the exchange rate for US$1.00 was CN$1.57 (average annual rate). For many years, the exchange rate was one of the incentives used to attract our neighbours from the south with slogans like “Stretch your dollar!” Clearly, the dollar’s sudden parity is of great concern, given that stakeholders across the board are looking for ways to stimulate this declining market, so key to the health of our tourism industry.

Since 2002, a record year for the number of American tourists in Canada, the numbers have been falling steadily, apart from a brief respite in 2004. And yet, is the exchange rate truly the prime culprit? Have we overestimated its influence on the travel behaviour of Americans?

The situation elsewhere

To better understand and put into perspective how the exchange rate truly affects the travel decisions of Americans, we have compared changes in the value of the loonie with those of other currencies (see Figure 1). We have examined fluctuations in the US dollar since 1995 in relation to the Canadian dollar, the euro, the Mexican peso and the Japanese yen. At the same time, we have charted the annual number of US citizen international departures to Canada, Mexico and overseas. To make the data comparable, we have established 1995 as the reference year, with an index of 100. The lines in the graph below illustrate the increases and decreases noted in relation to the reference year.

CP_2007-09_taux_change_grphq1

This graph shows the decline of the US dollar in relation to the Canadian dollar (red line) is much more dramatic than the drop in the number of American tourists to Canada (broken red line). The departures in question refer to stays of one night or more, as day trips have, in fact. recently dropped more precipitously.

Venturing further afield

It is a mistake to believe Americans no longer travel due to a combination of factors like a weak currency, security concerns, a turning inward, etc. The line tracking the number of Americans travelling overseas (broken blue line) eloquently shows that Americans are more interested than ever in discovering new destinations. For example, according to a survey of AAA travel agencies, reservations for US travellers to Eastern Europe jumped 55% in the summer of 2007.

Though there was certainly a temporary drop in the period immediately following 9/11, interest in far-flung destinations rebounded as of 2003. In fact, the euro is the most relevant currency in the analysis of how exchange rates influence US travel abroad (though we have included the yen for information purposes). Like that of the Canadian dollar, the euro’s value has appreciated significantly (dark blue line) vis-à-vis the US dollar since 2001. And yet, during the same period, the number of international departures from the US increased dramatically.

The example of Mexico

Mexico is a very interesting case because its geographic proximity to the US is similar to that of Canada. Unlike the Canadian dollar, the Mexican peso has been falling steadily in value against the US dollar since 1995 (green line). However, this growing purchasing power has not affected the decision to travel to Mexico, with the number of US tourists to the country remaining relatively flat (broken green line).

A closer look at two other indicators

A basic notion in economics is the idea of “All other things being equal.” This is often used as a premise when analyzing economic phenomena. However, in real life, all other things are never equal, a caveat that must be kept in mind when referring to the analytical model presented in Figure 1.

CP_2007-09_taux_change_grphq2

The travel intentions of citizens are often tied to their country’s economic performance. For this reason, we felt it was interesting to compare the change in the number of American tourists travelling to Canada and overseas with two other economic vectors: the level of personal consumer spending (purple line) and the price of gas (yellow line).

Without doubt, skyrocketing gas prices do nothing to encourage proximity tourism among Americans who usually travel to Canada by car. Over the past few years, the drop in the number of these travellers has been much more pronounced than the decrease in air travellers.

The change in US personal consumer spending is another interesting indicator of Americans’ ability and desire to spend. In fact, the graph shows that the significant increase in international departures is more or less in step with the spending indicator. Though our analysis may not be truly scientific, it does illustrate that Americans’ travel interests are evolving to the detriment of Canada.

Better understand the impact

Surveys show that the exchange rate can influence travel intentions, particularly among certain customer segments. When it comes to international travel, Americans demonstrate a lower sensitivity to currency fluctuations than Canadians.

Certain outside factors can enhance the potential impact of currency fluctuations. One such factor in particular is the media coverage lavished on the phenomenon; it would seem the Canadian media is more interested than the American media in the rise of our dollar.

It is also true that although Americans may not be very aware or influenced by the loss of their purchasing power, they definitely feel it once they reach their destination. The firm Moneris Solutions has studied US credit and bank card transactions at Canadian merchants. Total transactions in US dollars dropped in July and August 2007 compared to the same period in 2006.

This study did not take into account the number of visitors involved. Nonetheless, the numbers do indicate that spending budgets have dropped in a greater proportion than the number of American tourists. Other factors like falling room prices in 2007 also had an affect on the expenditure base. The study reveals the sectors most severely affected: specialized retailers (-35%), campgrounds and trailer parks (-22%), public golf courses (-14%), hotel reservations (-13%), bus travel (-13%) and restaurants (-8%)

A major challenge

Canada’s current difficulty recovering its share of the American market is deep-rooted and not due solely to economic factors. Other studies have reached the same conclusion: Americans no longer find Canada as attractive as they once did and would prefer to set their sights on new destinations. An unfavourable exchange rate and high gas prices are merely additions to the list of deterrents, particularly when it comes to proximity tourism. Now that our currency has reached parity, we must use innovation and an enriched tourism supply to change their minds!

Sources:
– Montet, Virginie. “Les touristes américains découvrent l’Europe de l’Est,” La Presse, September 26, 2007.
– Office of Travel & Tourism Industries.
– Turner, Riva. “US Spending in Canada Sees Significant Decline,” Moneris Solutions [www.moneris.com], September 24, 2007.
– US Census Bureau.

Catégories
Management

Is your destination in decline?

« Tell me who visits your destination, and I’ll tell you whether it’s in decline! » This was the bet made by Stanley Plog when he developed his model of matching traveller profiles with phases in a destination life cycle. When a destination is visited by large numbers of tourists, it has reached a critical phase in this cycle; to avoid decline, destinations must understand that tourism growth must be planned and controlled.

The life cycle of a destination: from discovery to decline

There are five different traveller profiles in Stanley Plog’s model: from venturers to dependables. According to Plog, these various tourist personality types are associated with phases in a destination life cycle because the type of tourist who visits a region indicates the area’s level of development, and in some ways determines its life cycle. Figure 1 illustrates the various phases in a tourist area’s life cycle (TALC), which were developed by R.W. Butler, Ph.D, in 1980.

Figure 1

MLa_talc


Discovery
During this phase, a little known destination is visited by the first venturers in search of new discoveries and unexplored areas. Through word-of-mouth, the area begins to attract more tourists.

Discovery – Development
Once venturers have begun exploring a destination, they are followed by near-venturers. This creates the first major wave of visitors who – because they are more demanding in terms of services – initiate real development.

Development
With the destination’s notoriety growing, the media, always looking for something new, show up in the region and enthusiastically report on its charm and cachet. This then « condemns » the destination to rapid growth and the arrival of so-called centric travellers. Growth continues and everyone is happy: the number and value of hotels increases; jobs multiply; government coffers overflow with taxes; many areas are enhanced; local stakeholders smugly congratulate themselves on finding a gold mine and believe that tourism is the perfect industry to ensure longevity and unlimited growth. By this time, venturers and near-venturers have abandoned the area and mass tourism has arrived.

This phase is crucial because when a destination is really booming, no one cares about planning or controls. For this reason, it is important to take action at this stage to manage development and define a long-term vision.

Maturity – Decline
Riding this wave of popularity, a destination is too often lax in its regulations: the number of hotels continues to grow; fast-food restaurants pop up everywhere; shops, movie theatres and other forms of entertainment multiply; wholesalers develop packages. The area starts to get « touristy » and there is unchecked development. The destination is unable to resist the easy money of tourism and unsustainable development. Under such pressure, the destination loses its distinctiveness and looks like any other destination. The centrics now stop coming and the near-dependables start to frequent the area. According to Plog, if 30% or more of a destination’s reservations come from package deals, the destination has begun a decline that will last for several decades.

Decline
Despite the boom, decline is now inevitable. The destination now only attracts dependables, who prefer to visit and revisit well-established known quantities. Though often more loyal, this clientele spends less, stays a shorter time and is less active. The destination becomes less lucrative. Deserted by the other tourist segments, the market gets smaller. Managers don’t understand what has happened because arrivals kept rising. The destination must then try to differentiate itself and reposition itself in the market.How many times has this happened? Emerging destinations suddenly become popular and then are ignored as travellers head to newly discovered destinations. Over-crowding leads to decline and a different traveller clientele, and then everything changes!

Obviously, Plog’s model does not apply to every destination, but it does provide food for thought. Furthermore, a destination may find itself in a different position on the curve depending on whether one is considering local, regional, national or international travellers.

Can decline be overcome?

According to Michael Leven, a 45-year hotel-industry veteran, only an earthquake can revive a product at the end of its life cycle. One way to overcome decline is for a destination to develop a new product to give itself a boost or reposition itself and change its marketing strategy. As an example, Leven points to the cruise industry, which languished for many years and then successfully rallied by developing products to meet the needs and preferences of different types of travellers, from Antarctic cruises to classic luxury cruises to thematic cruises.

The case of Costa Rica

A group of researchers from the Cornell University School of Hotel Administration used Plog’s model to examine the profile (behaviour and preferences) of American travellers to Costa Rica. From 1999 to 2003, the number of tourists in Costa Rica grew 20%, with Americans accounting for the biggest jump, 30%. The country’s beautiful landscape make it one of the most popular destinations in Central America and it definitely attracts more international travellers than its neighbours (Belize, Salvador, Guatemala, Honduras, Nicaragua and Panama).

With such an increase in tourist arrivals, one would say the destination is in the development phase. The study findings confirm this as well, indicating that the country is becoming more popular with centrics and that fewer near-venturers are visiting now. If Costa Rica wants to continue riding this crest, it must orchestrate its growth so as to avoid excessive or inappropriate development, because it enjoys a high profile as an ecotourism destination.

Plog’s model applied to US visitors to Canada

Although statistics show Americans are travelling abroad in record numbers, the drastic drop in their numbers to Canada could signal the decline of Canada as a destination. On the other hand, perhaps the exchange rate, the price of gas and upcoming heightened security measures are the only reasons behind this dip. Still, near-dependables and dependables (who make up the smallest percentage of the population) may continue to visit Canada, while the centrics (who make up a majority of the population) will abandon it for more exciting or attractive lands. It may be time for Canada to start courting other American states, revamp and reposition its product for its neighbours or even target other clienteles.

Maintain attractiveness, or perish!

If there were a magic formula, many destinations would have adopted it long ago. However, once a destination understands how the life cycle works, it can control development and maintain its ideal position. Here are a few suggestions:

  • Understand what makes the destination attractive and capitalize on its features and distinctiveness
  • Develop new products that reflect travellers’ changing socio-demographics and values
  • Become familiar with the profile of tourists
  • Plan and control development
  • Preserve the original character of spaces
  • Do not allow business to call the shots
  • Orchestrate marketing for the target clientele
  • Encourage locals to take part in the success of the experience (after all, residents don’t want to lose their quality of life and the things that make their community special)

According to Stanley Plog, destinations that do not plan their development are only harming themselves – by losing the charm that attracted venturers in the first place!

Sources:
– Enz, Cathy A. et al. « Competitive Destination Planning: The Case of Costa Rica, » Cornell University, Center for Hospitality Reports, Vol. 6, No. 12, October 2006.
– Plog, Stanley. « Why Destination Areas Rise and Fall in Popularity, » Cornell Hotel and Restaurant Administration Quarterly, Vol. 42, No. 3, June 2001.
– Weiermair, Klaus. « Le vieillissement – Une réalité qui s’impose aux destinations touristiques, » Espaces, No. 235, March 2006, p. 18-20.