Catégories
Accommodation etourism and technology

Online Behaviour of Airbnb Travellers

The private accommodation rental market has not escaped the tidal wave of online information that brings us to today’s diversified offer on a number of specialized sites. The PhoCusWright study states that, in the United States, the penetration rate of these online reservations has gone from 12% in 2008 to 24% in 2012. The arrival of start-ups in the collaborative economy, such as Airbnb, and the improvement of already well-established sites in this market, such as HomeAway, have helped accelerate this trend.

This trend gave rise to a new generation of renters, or “New Gen Renters,” whose travel behaviour differs from that of travellers who use other types of accommodation. This distinction was made following an analysis of these travellers, that was based on a PhoCusWright study of their online planning and booking habits. The results of that study are described below.

AL_Airbnb_2_encadre_anglais

New Gen Renters very active online

When planning their leisure trips, New Gen Renters are more likely to search the Web on a mobile device (32%) or a tablet (29%) than other renters (see Graph No. 1). They also more frequently use other sources of information, such as recommendations from relatives and friends, online advertising and promotional emails. The behaviour of other renters more closely resembles that of other travellers who do not rent private accommodation.

AL_Airbnb_2_graph_1_anglais

New Gen Renters browse more sites to compare and choose the various components of their trip

All three categories of traveller primarily access the same sources for their online trip planning (see Graph No. 2). Online travel agencies such as Expedia or Priceline came first, followed by search engines and comment sites such as TripAdvisor. However, New Gen Renters browse more sites to compare and choose the various components of their trip. Almost 40% of these new renters use social media, compared to 11% of other renters and 12% of non-renters. This gap also holds true for travel guide sites and online magazines, news websites and private accommodation rental websites – although the latter category is also accessed by a significant proportion (20%) of other renters.

AL_Airbnb_2_graph_2_anglais

What online content are they looking for?

New Gen Renters have a strong appetite for online travel content (se       e Graph No. 3). They access comments and opinions, professional and amateur photos and videos, and supplier posts to plan at least half of their stays. They are far more likely than other renters and non-renters to view this information on social media.

AL_Airbnb_2_graph_3_anglais

Inspiration and personalization

The inspirational aspect of the site is very important for this new generation. Indeed, 41% of them look for new trip ideas online, whereas this objective is only shared by 28% of other renters and 29% of non-renters. This group is also looking for a more personalized web browsing experience than the other traveller groups, with 27% preferring a site that saves their personal information in order to recognize them on subsequent visits, compared with 12% of other renters and 9% of non-renters.

New Gen Renters are spontaneous

The “other renters” category books its stays further in advance than other segments: 57% do so at least one month before departure, whereas only 41% of New Gen Renters and half of non-renters adopt similar behaviour (see Graph No. 4). In fact, there are proportionally more last-minute New Gen travellers, as 43% of them book less than three weeks before their trip is due to start, compared to 33% of other renters and 31% of non-renters.

AL_Airbnb_2_graph_4_anglais

Keen collaborative consumers

According to PhoCusWright, New Gen Renters tend to use collaborative sites such as Airbnb to book their accommodation. This segment is also attracted by a similar approach to getting around: 21% of these avid users of new technology used a car-sharing app during their stay, compared to a fairly low percentage (6%) of other renters, and only 2% of non-renters. They are also more likely (25% compared to 11% and 6%, respectively) to have used app-based rideshare services such as Uber and Sidecar.

Should the traditional hotel market be concerned?

According to PhoCusWright’s probability calculations based on the frequency of travellers’ leisure trips, it seems that each time a traveller rents private accommodation, the chances he or she will book a hotel room within the same year drop by 24%. Similarly, if a traveller stays in two rentals over the course of the year, the chances he or she will stay in a hotel drop by 50%. In other words, the more often travellers stay in private accommodation, the less likely they are to book a hotel room. While this statement may alarm hotel owners, they should remember that, in 2013, only 14% of U.S. travellers rented a private house or apartment, and only 3% booked a room or a bed in a private home. In fact, it was the least popular type of accommodation.

Fundamental shift or passing trend?

Will the advocates of collaborative consumption – largely members of Generation Y – continue to travel this way as they grow older? It is difficult to predict the future, but one thing is certain: their use of the Internet and an array of technological tools is permanently rooted in their travel behaviour. Accommodation providers therefore have no choice but to react – and adapt to! – this enduring trend!


Image à la une: © istockphoto

Catégories
Accommodation etourism and technology

Who are these travellers booking on Airbnb?

Renting short-term lodging has become an increasingly common accommodation choice for travellers, made popular by the advent of websites such as Airbnb. A survey conducted in the U.S. by PhoCusWright profiles these users and defines their behaviour as it compares to that of other traveller groups.

Methodology

The web survey was conducted in February and March 2014 among 1,880 American respondents who had made at least one leisure trip during the previous 12 months. To be eligible for the survey, they had to have reserved commercial accommodation and planned the trip themselves. The company identified two categories of traveller: those who rented private accommodation (room, house or apartment), i.e., the renters (17%), and those who booked other types of accommodation for their stay (non-renters; 83%).

Young travellers with a good income

A number of factors separate the renters from the non-renters: over half (51%) of U.S. travellers who rented private accommodation during the previous year were under 35, compared to 38% of travellers who booked another type of accommodation (see Graph 1).

AL_Airbnb_1_anglais_graph_1

There was also a definite difference in earnings between the two traveller groups: 33% of non-renters had an annual household income of less than US$50,000, compared to 24% of renters. Also, the proportion of the latter group with incomes between $50,000 and $125,000 is higher than it is among non-renters, indicating that, generally speaking, renters are more prosperous than other traveller group.

Renters travel for longer and are more active

Almost two out of three renters (63%) travelled for one or two weeks during the previous year, while only 43% of non-renters were away for the same period of time. Furthermore, the first group made more trips abroad (42%, compared to 31%).

Aside from flights, renters are proportionally more likely than the other group to book several components of their trip (car rental, package, cruise, train, visit). This fact makes them more active travellers, who tend to do more (see Graph 2).

AL_Airbnb_1_anglais_graph_2The “New Generation of Renters” – a distinct category
Among the travellers who rented a private room, house or apartment during the past year, PhoCusWright has defined a new category of traveller that it calls “New Gen Renters.” Between 18 and 34, these travellers represent 31% of all renters and see themselves as avid users of new technology.

This group spends more on vacations and travels more frequently. In fact, a typical household in this category allocates an average of US$4,338 per year to travel, compared to US$3,743 for the other renters and US$3,153 for non-renters. Furthermore, 27% of these travellers have made at least six trips during the previous year, compared to 15% of the other renters and 9% of non-renters.

New Gen travel behaviour

Several aspects of New Gen travel behaviour distinguish this group from other travellers, such as:

  • They want to explore the destination as much as possible: meet new people and share their experiences with them;
  • They are spontaneous, travelling as soon as they have the means to do so;
  • When staying in commercial accommodation, they seek out stylish, smaller hotels;
  • They like to travel alone or with friends.

Preferred types of accommodation

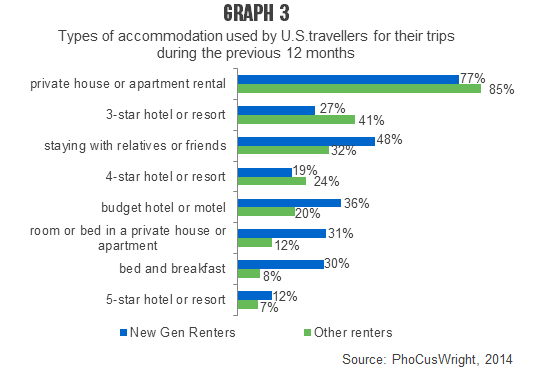
New Gen Renters tend to spend less on accommodation than other renters, since they are more likely to stay in budget hotels, bed and breakfasts or rooms, or else rent a bed in a private home (see Graph 3).

Note that PhoCusWright distinguishes between two types of rental accommodation: the one where the customer rents the entire residence from which the owner is usually absent (see “private house or apartment rental,” below); and the one where the renter only has access to part of the residence, and where the owner is usually present during the rental period (see “room or bed in a private house or apartment,” below). The latter type can be found on websites such as Airbnb, but is completely absent from websites such as HomeAway, that specialize in the first type of rental accommodation.

AL_Airbnb_1_anglais_graph_3

Why choose a rental over hotel accommodation?

The three main deciding factors for all renters are that they can find similar facilities and equipment to those at home, that they have more space, and that the rental can accommodate more people (see Graph 4). However, New Gen Renters particularly like the fact that rentals provide more freedom and privacy than a hotel room, that they offer a more relaxed ambiance, and that they are generally less expensive.

AL_Airbnb_1_anglais_graph_4

How will hotel owners react?

Should hotel owners be alarmed at the prospect of losing part of their clientele to private accommodation? According to PhoCusWright, 82% of non-renters did not even consider the rental option for their trips during the previous 12 months. However, hotel operators would do well to adapt to these New Gen Renters because, although rentals may better meet their needs, they nevertheless use different types of accommodation when travelling.

A second analysis examines the online planning and booking habits of this New Generation, and looks at possible ways of resolving the concerns of the hotel industry.


Image à la une: © BY NC Melies The Bunny

Catégories
Facts and figures Geographic markets Issues

Dollar (dis)parity is only part of the problem

Now the Canadian dollar has reached parity with its US counterpart, many questions are being raised. Without doubt, Canada’s performance in the American tourist market has been disappointing in recent years and the inexorable rise of the Canadian dollar in 2007 has only increased the level of anxiety in our industry. However, is our tourism deficit closely tied to the vagaries of the exchange rate? Is it a given that the flying loonie will aggravate our poor performance? By examining the issue from a broader perspective, we find that the reality is much more complex. We shouldn’t be too quick to blame all our tourism woes on the dollar exchange rate.

Concerns for the US market

The rise of the Canadian dollar in relation to that of Uncle Sam has been truly spectacular over the past five years. In 2002, the exchange rate for US$1.00 was CN$1.57 (average annual rate). For many years, the exchange rate was one of the incentives used to attract our neighbours from the south with slogans like “Stretch your dollar!” Clearly, the dollar’s sudden parity is of great concern, given that stakeholders across the board are looking for ways to stimulate this declining market, so key to the health of our tourism industry.

Since 2002, a record year for the number of American tourists in Canada, the numbers have been falling steadily, apart from a brief respite in 2004. And yet, is the exchange rate truly the prime culprit? Have we overestimated its influence on the travel behaviour of Americans?

The situation elsewhere

To better understand and put into perspective how the exchange rate truly affects the travel decisions of Americans, we have compared changes in the value of the loonie with those of other currencies (see Figure 1). We have examined fluctuations in the US dollar since 1995 in relation to the Canadian dollar, the euro, the Mexican peso and the Japanese yen. At the same time, we have charted the annual number of US citizen international departures to Canada, Mexico and overseas. To make the data comparable, we have established 1995 as the reference year, with an index of 100. The lines in the graph below illustrate the increases and decreases noted in relation to the reference year.

CP_2007-09_taux_change_grphq1

This graph shows the decline of the US dollar in relation to the Canadian dollar (red line) is much more dramatic than the drop in the number of American tourists to Canada (broken red line). The departures in question refer to stays of one night or more, as day trips have, in fact. recently dropped more precipitously.

Venturing further afield

It is a mistake to believe Americans no longer travel due to a combination of factors like a weak currency, security concerns, a turning inward, etc. The line tracking the number of Americans travelling overseas (broken blue line) eloquently shows that Americans are more interested than ever in discovering new destinations. For example, according to a survey of AAA travel agencies, reservations for US travellers to Eastern Europe jumped 55% in the summer of 2007.

Though there was certainly a temporary drop in the period immediately following 9/11, interest in far-flung destinations rebounded as of 2003. In fact, the euro is the most relevant currency in the analysis of how exchange rates influence US travel abroad (though we have included the yen for information purposes). Like that of the Canadian dollar, the euro’s value has appreciated significantly (dark blue line) vis-à-vis the US dollar since 2001. And yet, during the same period, the number of international departures from the US increased dramatically.

The example of Mexico

Mexico is a very interesting case because its geographic proximity to the US is similar to that of Canada. Unlike the Canadian dollar, the Mexican peso has been falling steadily in value against the US dollar since 1995 (green line). However, this growing purchasing power has not affected the decision to travel to Mexico, with the number of US tourists to the country remaining relatively flat (broken green line).

A closer look at two other indicators

A basic notion in economics is the idea of “All other things being equal.” This is often used as a premise when analyzing economic phenomena. However, in real life, all other things are never equal, a caveat that must be kept in mind when referring to the analytical model presented in Figure 1.

CP_2007-09_taux_change_grphq2

The travel intentions of citizens are often tied to their country’s economic performance. For this reason, we felt it was interesting to compare the change in the number of American tourists travelling to Canada and overseas with two other economic vectors: the level of personal consumer spending (purple line) and the price of gas (yellow line).

Without doubt, skyrocketing gas prices do nothing to encourage proximity tourism among Americans who usually travel to Canada by car. Over the past few years, the drop in the number of these travellers has been much more pronounced than the decrease in air travellers.

The change in US personal consumer spending is another interesting indicator of Americans’ ability and desire to spend. In fact, the graph shows that the significant increase in international departures is more or less in step with the spending indicator. Though our analysis may not be truly scientific, it does illustrate that Americans’ travel interests are evolving to the detriment of Canada.

Better understand the impact

Surveys show that the exchange rate can influence travel intentions, particularly among certain customer segments. When it comes to international travel, Americans demonstrate a lower sensitivity to currency fluctuations than Canadians.

Certain outside factors can enhance the potential impact of currency fluctuations. One such factor in particular is the media coverage lavished on the phenomenon; it would seem the Canadian media is more interested than the American media in the rise of our dollar.

It is also true that although Americans may not be very aware or influenced by the loss of their purchasing power, they definitely feel it once they reach their destination. The firm Moneris Solutions has studied US credit and bank card transactions at Canadian merchants. Total transactions in US dollars dropped in July and August 2007 compared to the same period in 2006.

This study did not take into account the number of visitors involved. Nonetheless, the numbers do indicate that spending budgets have dropped in a greater proportion than the number of American tourists. Other factors like falling room prices in 2007 also had an affect on the expenditure base. The study reveals the sectors most severely affected: specialized retailers (-35%), campgrounds and trailer parks (-22%), public golf courses (-14%), hotel reservations (-13%), bus travel (-13%) and restaurants (-8%)

A major challenge

Canada’s current difficulty recovering its share of the American market is deep-rooted and not due solely to economic factors. Other studies have reached the same conclusion: Americans no longer find Canada as attractive as they once did and would prefer to set their sights on new destinations. An unfavourable exchange rate and high gas prices are merely additions to the list of deterrents, particularly when it comes to proximity tourism. Now that our currency has reached parity, we must use innovation and an enriched tourism supply to change their minds!

Sources:
– Montet, Virginie. “Les touristes américains découvrent l’Europe de l’Est,” La Presse, September 26, 2007.
– Office of Travel & Tourism Industries.
– Turner, Riva. “US Spending in Canada Sees Significant Decline,” Moneris Solutions [www.moneris.com], September 24, 2007.
– US Census Bureau.

Catégories
Facts and figures Geographic markets

American tourists: Where have they gone?

In 2004, Americans once again began travelling to foreign destinations in large numbers, but they seem to have ignored Canada. The number of U.S. international tourists ?all destinations combined ? reached a record high of 61.8 million that year, surpassing the previous record set in 2000. And yet, since the new millennium, Canada has noted a significant decline in the number of U.S. visitors. From 2000 to 2004, this figure fell 21.3% and preliminary data for the January to October 2005 period show a decrease of 8.7% compared to the same period in 2004.

Fewer U.S. visitors to Canada

The marked decline in the number of Americans travelling to Canada is of concern to the entire tourism industry, although the drop has not affected all the provinces in the same way. In fact, from 2000 to 2004, compared to the other Canadian provinces, Quebec appears to have been less affected by the Americans’ decision to desert Canada.

If we do a monthly comparison of U.S. arrivals to Canada in 2000 and 2004 (Graph 1), the slump is proportionally less significant during the summer months (June: -18.8%, July: -16.5% and August: 19%). However, in absolute numbers, losses are the highest during the months of the high season (July: 981,777 visitors and August: -1,079,657 visitors).

Major drop in same-day visitors

It is important to note that 98% of the decline in U.S. visitors to Canada is due to a sharp drop in same-day visitors, a situation that affects Ontario in particular since this province welcomed three-quarters (74.4%) of the total U.S. same-day visitors in 2000 (Table 2). From 2000 to 2004, the number of same-day visitors to Ontario fell by over 7.5 million.

Therefore, if we look solely at the number of tourists (Graph 2), the decline in the U.S. travel market is much lower, proportionally speaking. In fact, from 2000 to 2004, the number of Americans spending one night or more in the country dropped a mere 1.11%. During the same period, Quebec even recorded an increase of 3.38%.

2002: Base year or exception?

In 2002, Canada welcomed a record high of 16.17 million U.S. tourists. This increase of nearly 650,000 tourists compared to 2001 occurred at a time when the number of U.S. travellers to international destinations plummeted 1.3 million. Of course, this extraordinary performance can be explained, in part, by the public’s reaction to the events of 2001: travellers sought safety by staying close to home.

The 2002 increase was fuelled primarily by a jump in leisure travel since the number of business tourists in this record year only reached 1.96 million, a decrease compared to the 2.16 million recorded in 2000 (Graph 3). Furthermore, for the past several years, business travel has made up a proportionally smaller share of Canada’s U.S. travel market.

2005: The true decline begins

Preliminary data for the year 2005 (January to October) illustrate a trend of concern to the entire Canadian tourism industry, particularly that in Quebec.

This drop appears to be due to border markets, because in the first ten months of 2005, the number of American tourists arriving by car dropped 13.5%, while the number of those using other modes of transportation increased 6.4%.

Americans travelling to see the world

In 2004, Americans travelled abroad as never before, surpassing the record set in 2000 (61.8 million vs. 61.3 million). However, during this same period, Canada recorded a decrease of nearly 175,000 U.S. tourists. An analysis of the regions visited (Table 4) demonstrates a major shift in the international travel habits of Americans.

According to Table 4, non-traditional destinations are enjoying an upswing in interest on the part of American travellers. At the same time, traditional destinations (Canada, Mexico and Western Europe) saw their market shares drop sharply from 2000 to 2004 (Graph 4).

Preliminary data from the U.S. government for the period January 1 to September 1, 2005, show that U.S. air traffic to overseas destinations rose 5%. Once again, Central America (+14%), Asia (+10%), South America (+9%) and the Middle East (+8%) recorded increases superior to that of Europe (+3%).

The Canadian tourism industry, which still hopes to repeat the success of 2002, must accept that things will never get « back to normal » because American and global realities have been so profoundly altered.

The situation according to the Canadian Tourism Commission (CTC)

In the fall of 2005, the CTC formed a task force to examine the U.S. market. Its preliminary findings seem to confirm that Canada cannot blame factors like SARS, the war in Iraq, exchange rates or border-crossing issues for the country’s failure to attract U.S. tourists. The Americans interviewed by the CTC note that while they have no specific reasons for staying away from Canada, they are not motivated to come here either. This means that Canada is not successfully distinguishing itself from other destinations in an increasingly competitive field. The CTC’s final report is expected in late January 2006.

Sources:
– Canadian Tourism Commission. « US market taskforce expands mandate, » Tourism, Vol. 002, Issue 11, November-December 2005.
– Ontario Ministry of Tourism and Recreation. « Regional Tourism Profile – Provincial Markets Shares », www.tourism.gov.on.ca/english/tourdiv/research/rtp/2003/
ComparitiveReportsProvinces/index.html

– Statistics Canada. “International Travel Survey,” Catalogue No. 66-001-PIB, January 2000 to October 2005.
– U.S. Department of Commerce, ITA, Office of Travel and Tourism Industries. “U.S. Citizen Air Traffic to Overseas Regions, Canada; Mexico 2005,” www.tinet.ita.doc.gov, 2005.
– U.S. Department of Commerce, ITA, Office of Travel and Tourism Industries. « U.S. Resident Travel Abroad Historical Visitation – Outbound 1994-2004, » July 2005.

Catégories
etourism and technology Marketing @en

Show me the room!

When it comes to reserving a hotel room online, what criteria are important? According to a recent survey of US internet users, being able to see the place is key. With the increased adoption of high-speed internet, suppliers can now do a better job selling an experience, rather than just a price.

According to a recent survey of approximately 2,900 adult US internet users conducted by Harris Interactive for VFM Interactive, after considering price and location, consumers now want to see photos when they reserve a hotel room. In fact, 73% of the respondents who stay in hotels said they went online to research their accommodations. Of this number, 71% considered the written description very important while 69% said the same of the visuals.

The survey also showed that some groups of online travellers are more interested in the visual aspect than others.

This is true for the following:

  • women (36%), compared to 21% for men
  • families with children; in fact, 35% of households with children find visuals important, versus only 25% of those without children

For 28% of online travellers, visuals were rated « very important, » ahead of:

  • description of property (23%)
  • information about the destination (17%)
  • star ratings (14%)
  • customer testimonials (13%)
  • hotel brand (11%)

Internet and streaming video

Streaming video is a technology that should encourage the travel industry to take a second look at the internet. With its ability to transmit both audio and video, the internet is ideal for conveying information, and with the increased use of high-speed (broadband) connections, streaming video is now more common.

Although still photographs work well as promotional tools, streaming video is an even more effective medium. All businesses using the internet to sell or promote products should consider the use of this technology:

  • a night in a hotel (the Ice Hotel, for example)
  • a day at a spa (the Scandinavian Spa in Tremblant, for example)
  • a show (in Las Vegas, for example)
  • an entire region (BonjourQuebec.com, for example)
  • a gourmet meal in a top-rated inn
  • a tour of the Père-Lachais cemetery in Paris
  • or any other product or service
  • and don’t forget 360-degree virtual tours.

Streaming video can present a highly realistic portrait of your business: a virtual tour, an overview of the site, a demonstration of a product or service, a commercial, filmed testimonials from satisfied customers, etc.

Video can capture dreams, desires and longings. It is therefore an ideal communication tool well-adapted to the tourism and recreation sector. Video can inform and reassure consumers; it inspires trust and can help break down the final barriers to the act of purchasing.

It is not complicated to add streaming video to a website (webcasting). However, for visitors to be able to view it, they must have an appropriate multimedia application (that can be downloaded for free). Although Media Player is the most common program for Windows users, it is always a good idea to offer videos in several different versions so they can be read by other applications like Real Player and QuickTime, for example.

Although the quality of the video depends on the user’s connection speed, the technology is very promising because it can make information available in real time, just like television. And with more and more homes now enjoying the same type of high-speed connections found in workplaces, the market should really explode in the coming years.

When speed is an advantage

According to a recent survey of 3,000 Canadians conducted in May and June of 2004 by the Canadian Internet Project (CIP), 72% of the Canadian population uses the internet, either from public or private sites. Some of the survey’s other findings:

  • a majority of Canadians use the internet a lot: 56% say they spend at least seven hours per week online
  • most of the time, they use the internet at home or at work, rather than in public places
  • internet users spend less time than non-users on traditional media like television or newspapers and magazines

In Canada, broadband internet services have made major inroads in a short time. In 2003, 66% of businesses had high-speed access (compared to only 48% in 2001). Overall, in both homes and workplaces, Canada is a world-wide leader in broadband penetration. In fact, in 2005, 67% of Canadian households enjoyed broadband access and some experts believe that this number will rise to 81% by the year 2007.

In the United States, according to the latest estimates of the Pew Internet & American Life Project, broadband adoption at home has also grown in recent years. In May 2005, 53% of the internet users surveyed had a high-speed connection at home (compared to 50% in December 2004).

In conclusion, high-speed internet and related technologies like streaming video are proving to be fundamental tools for businesses of all sizes. For users, the technology has many advantages, and with the growing popularity of media for private viewing (like podcasts), videos can be downloaded and viewed on cell phones and iPods, or saved and forwarded to friends. The possibilities are endless!

Sources:
– eMarketer. « Travel Shoppers Say: ‘Show Me a Picture’, » November 16, 2005.
– PRNewswire. « The Majority of Online Travelers Rate Hotel Visuals Among Top Influencing Factors in Selecting a Hotel Online, » November 14, 2005.
– Horrigan, John. « Broadband Adoption at Home in the United States: Growing but Slowing, » Pew Internet & American Life Project, September 21, 2005.
– Uhrbach, Mark and van Tol, Bryan. « Broadband Internet: Removing the Speed Limit for Canadian Firms, » Statistics Canada, Science, Innovation and Electronic Information Division, September 2004.

Catégories
Customer segments Products and activities

The cultural travel market

American cultural travellers represent an especially lucrative market: nearly one-third spend over US$1,000 when they travel. By way of comparison, only 11% of all U.S. travellers spend this much. This news comes from Renee Mitchell, Research Director, Smithsonian Magazine, speaking at the most recent TIA Marketing Outlook Forum. Her presentation discussed the demand for cultural travel.

Characteristics of cultural travellers

Over 44 million American cultural tourists stay in commercial lodgings when they travel and generate an estimated US$29 billion per year in travel spending. Around 76% of them are leisure travellers, while 24% are business travellers. Some specific traits of cultural travellers are listed below:

  • Average age is 46 years old
  • Average household income is US$75,800
  • 62% are married
  • 87% have a college diploma or higher
  • 31% have children living at home
  • 37% travel during the summer

Interest in culture = interest in travel

According to Mitchell, Americans interested in history and culture, like the readers of Smithsonian Magazine, are especially interested in travel with an historic/cultural emphasis. A survey of the magazine’s readers showed:

  • 93% visit historic sites
  • 84% learn all they can about a destination before going there
  • 76% consider culture and heritage when selecting a destination
  • 71% explore towns off the beaten path

According to a TIA/Smithsonian survey, American cultural travellers can be characterized by the four « L’s »:

  • Learning – 82 million say, « Trips where I learn something new are more memorable. »
  • Leisure Activities – 67 million say, « My hobbies and interests influence my destination selection. »
  • Locals – 63 million say, « While on vacation, I like to find places that are popular with locals. »
  • Love it! – 34 million say, « Vacation/leisure trips including cultural activities are more important to me. »

Not the same as other travellers

Comparing cultural travellers with other travellers reveals some interesting differences. For example, cultural travellers spend a lot more than other travellers and tend to stay at destinations for much longer (see table). In addition, they are very active tourists: nearly half of those who stay in hotels participate in at least four activities. They are fond of shopping, nightlife and urban sightseeing.

Table 1: Comparison of American travel behaviours

All travellers Hotel travellers Cultural hotel travellers

  • Spent US$1,000+ on trip 11% 20% 30%
  • Primary travel by air 19% 30% 32%
  • Trip = 3+ nights 41% 52% 66%
  • Trip = 7+ nights 13% 23%
  • 3+ people in party 19% 26%
  • 2+ activities on trip 38% 45% 88%
  • 4+ activities on trip 7% 45%
  • Shopping 29% 29% 47%
  • Nightlife/dancing 7% 10% 16%
  • City/urban sightseeing 10% 15% 30%

Source: Roper Reports 2004

Promising outlook for 2005

In 2005, the demand for historic/cultural travel products will be high. According to a Roper survey, among Americans planning to travel in 2005:

  • 24% will visit an historical site
  • 17% will take a fishing trip
  • 16% will visit a casino
  • 16% will go hiking or camping
  • 10% will purchase a package tour
  • 9% will visit a health spa

Renee Mitchell emphasized that the travel behaviour of cultural hotel travellers makes them very profitable targets. She also stressed that hotels are ideal cultural partners for promoting special products, packages, events, etc.

However, one must remain realistic with regard to the overall tourism potential of US travellers. It is increasingly difficult to get them to cross any borders. For Americans, the most important factor in selecting a destination is safety (75%), which has now surpassed affordability (62%). Obviously, statistics such as these tend to favour domestic travel. Nonetheless, Canada does offer proximity and a reputation for safety, which certainly gives it an edge over other destinations.

Source:
– The Roper Center – TIA and Smithsonian Magazine. « The Historic/Cultural Traveler » [www.tia.org], 2003.